From a report to a decision and its execution
Management does not need another set of charts. It needs a shared view of the company: objectives, results, variances, risks, and actions taken by business owners. When sales, finance, and operations calculate the same metric differently, a meeting starts with reconciling data. When a report shows a problem without identifying the responsible person, the decision remains in the minutes or an email.
We design a flow from data to action. We establish KPI definitions, combine information from systems, and present management with the right level of detail. A variance initiates a task, explanation, or approval. We assign a responsible person, deadline, and execution history to each decision, and its status returns to the management view.
Situations we organize
- The CFO and sales director present different margin values. A shared data layer maintains one definition, set of rules, and sources for the metric.
- Management sees a red KPI but does not know its cause or the response plan. The report allows users to move from the result to the company, product, region, or process and then assign an action.
- A risk is described in a presentation, while corrective actions are spread across several spreadsheets. The process connects the assessment, decision, owner, deadline, documents, and execution status.
- Every area reports separately. A management view combines finance, sales, operations, processes, and projects according to a shared calendar and scope of accountability.
- An analyst answers an urgent question by manually assembling data. A controlled flow prepares and checks the data, while the analyst focuses on explaining the change.
AI organizes signals, a person makes the decision
AI analyzes variance descriptions, documents, and data available in the process. It identifies missing information, connects related signals, and prepares a recommendation for the next step. A management board member or designated business owner assesses the output and approves the action. The system records the basis for the decision and who approved its execution.
We use existing models and configure them for the organization’s rules, data, and permissions. We do not train LLM or OCR models. Human control remains part of the process, particularly when a decision concerns a commitment, risk, employee, or contractor.
Explore AI solutions for business →
Objectives, decisions, and execution in one workflow
Management decisions span many departments. An investment requires financial data, an expert opinion, a risk assessment, and approval. An objective needs an owner, measure, and deadline. A policy exception should contain a justification, opinion, and approval trail. Without a shared process, each of these elements goes into a different tool.
We implement workflows that guide a case from request through analysis and decision to execution control. Roles, substitutes, deadlines, and approval thresholds route the case to the right people. Documents, comments, and subsequent versions remain with the decision. Management sees pending cases, missed deadlines, and actions that require escalation.
This solution complements business systems. ERP continues to record finance and operations, CRM manages commercial relationships, and the HR system stores employee data. The process layer connects people and decisions across these systems and returns approved data and statuses to them.
Explore solutions for contracts and legal departments →
Analytics and reporting for management
We preserve the valuable scope of management analytics that Astrafox has developed for years: strategic, tactical, and operational reports, ad hoc analysis, and the ability to move from an aggregate result to its cause. Management focuses on key metrics and objectives, but when a variance occurs, it must be able to reach the region, company, team, product, or transaction that explains the result.
Management reporting covers areas including:
- revenue, costs, margin, profit, budget, and forecasts,
- sales, order portfolio, target achievement, and service quality,
- inventory, purchasing, production, logistics, and resource utilization,
- strategic objectives, initiatives, projects, and milestones,
- process status, waiting time, returned cases, and overdue cases,
- risks, corrective actions, decisions, and accountability for execution.
We establish the meaning of each metric, its sources, update frequency, and responsible person. We combine data from ERP, CRM, spreadsheets, AMODIT, HR systems, operational applications, and databases. DataFlow automates data preparation, runs tests, and shows data lineage. We build the reporting layer in technologies used by the organization, including Power BI, Tableau, and Qlik.
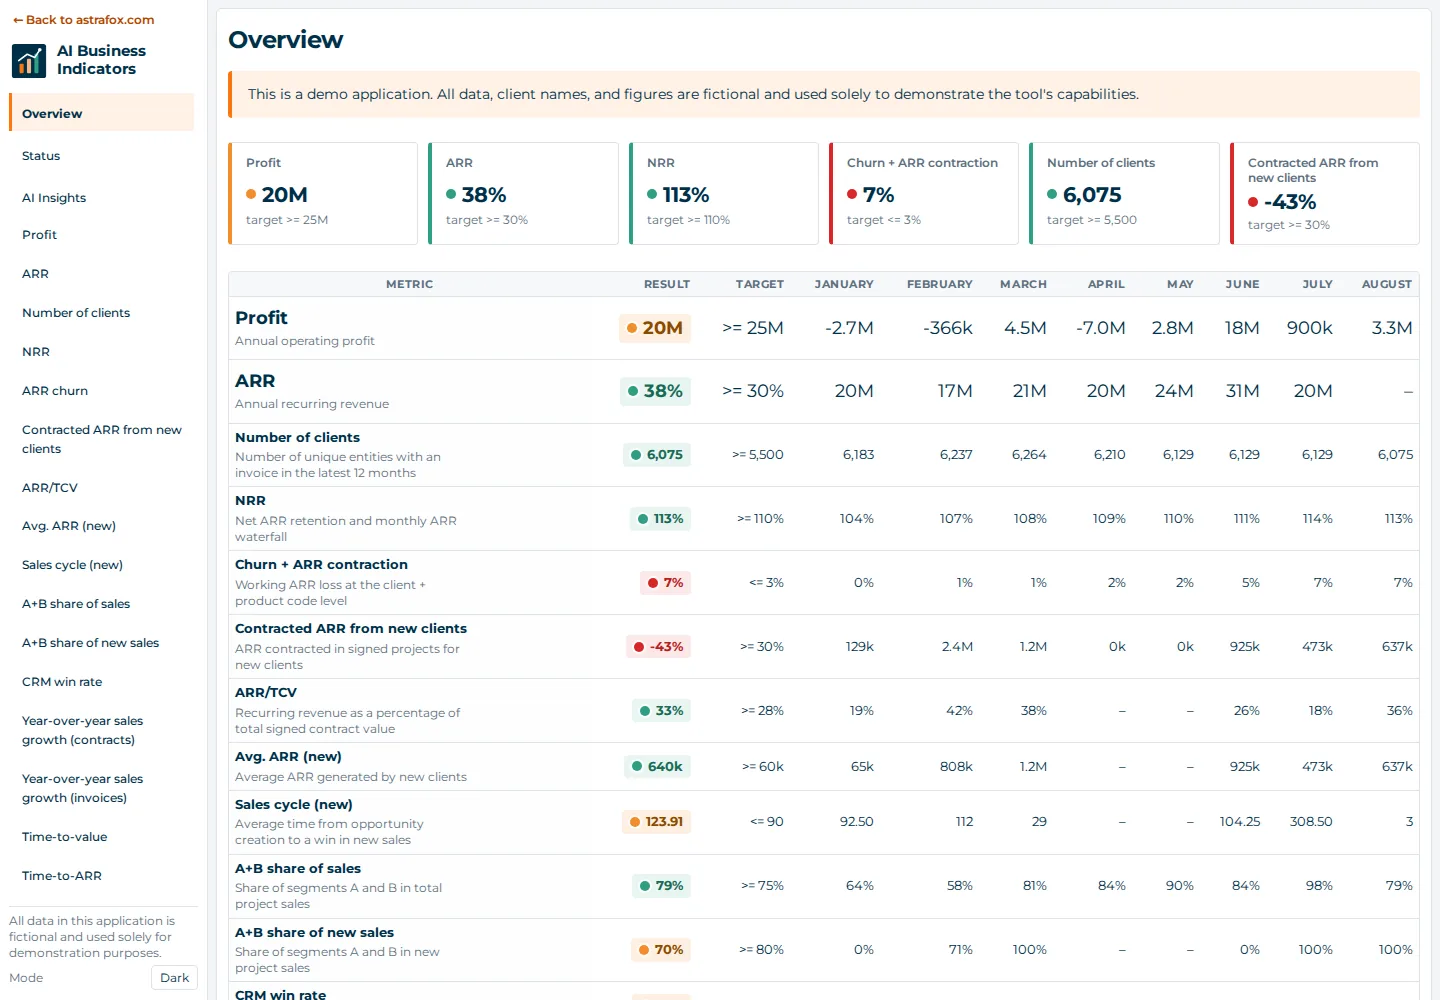
BI tools also support data discovery: ad hoc analysis, finding new opportunities to improve a process, and quickly testing hypotheses. An analyst answers questions in dialogue with a decision-maker instead of building a separate report from scratch every time. During sudden change, management uses the same definitions and sources as in daily reporting.
Explore reports and dashboards →
Risks visible before the management meeting
Risk can be managed when it has assessment criteria, a responsible person, and an action plan. We connect the risk register with processes, contracts, projects, and metrics. A threshold breach, approaching deadline, missing document, or recurring exception routes the case to the designated person. Escalation does not depend on whether someone noticed a message or manually updated a presentation.
The management view presents both the risk level and the response status: who is analyzing the event, which decision was made, which actions are delayed, and what requires another approval. As a result, the discussion concerns the choice of action rather than reconstructing the history from multiple channels.
Integrations without replacing the entire environment
We connect processes, data, and reports with systems already operating in the organization. Integrations exchange master data, documents, metrics, statuses, and execution information. When a standard interface does not cover a required step, we build a connector or application that complements the existing environment.
The project also covers how connections will be maintained: monitoring, error handling, retries, permissions, and accountability for changes. Management receives a consistent view without starting the transformation by replacing all business systems.
Explore software and integrations →
Examples of completed solutions
A shared view of financial and operational performance
For an organization operating in multiple markets, we combined financial, sales, and operational data in management reports. Shared calculations covered revenue, costs, margin, profit, and workforce metrics. Country and regional reports used controlled data flows instead of separate spreadsheets assembled for each audience.
Program status connected to the case-handling process
For a large organization, we built a platform on which users submit documents and employees conduct assessment and make decisions in a controlled process. A management dashboard presents case status, deadlines, and program execution. The process, reporting, infrastructure, and maintenance remain covered by one accountability model.
Objectives and accountability in a group of companies
We built a solution that supports the alignment of objectives, weights, deadlines, and accountability for management teams. The process guides consultations, approvals, corrections, and change history, while reports show the status of agreements and execution. Roles and permissions divide accountability among companies and organizational levels.
Explore Astrafox case studies →
Why AMODIT for management?
AMODIT combines forms, documents, rules, roles, approvals, and decision history. A case begins with a request, KPI variance, risk, or document requiring an opinion. The process routes it to the right people, tracks deadlines, and records execution, while integrations retrieve context from source systems and return approved data.
On the Astrafox website, we present AMODIT implementation across the entire company environment: process analysis, integrations with ERP and other systems, data, reporting, cloud, and maintenance. The AMODIT page contains a complete description of product features.
Explore AMODIT and our implementation model →
Why Astrafox for management?
One team combines AI, Process Automation, Data & BI, Software & Integrations, ERP, and Cloud & Infrastructure. We have operated since 1999 and completed 1,100+ implementations. Every project has a named account manager, project manager, and deputy. One contract and one point of accountability cover the agreed solution layers.
This approach works when a process spans several systems, BI must initiate action, and a standard product needs to be connected to a nonstandard environment. After launch, we develop the solution and provide SLA-based support for the application, integrations, and infrastructure. The client can request a meeting with Astrafox’s owners. Once a year, we proactively propose meetings to key clients.
See why companies choose Astrafox →
The management perspective across industries
Explore all industry solutions and examples for finance and insurance, retail, wholesale, and consumer goods, and renewable energy. They show how management metrics, risks, and decisions arise from different operating models in each sector.
Frequently asked questions
How should a management dashboard be built?
We start with a decision, not a chart: who makes it, how often, which signal requires a response, and where the source data is located. We then establish KPI definitions, levels of detail, permissions, and the path from a variance to action. The first view covers the most important question and the minimum data required to answer it.
How can shared KPIs be established for management and departments?
Every metric receives a definition, owner, source, calculation rule, update frequency, and analysis dimensions. A shared model stores this logic outside private spreadsheets. Management and departments see different levels of detail but use the same definition.
How can data from several companies and different systems be combined?
We first map the sources, identifiers, dictionaries, and differences among companies. We then create a controlled flow with data validation and exception handling. Not all systems need to be replaced—the integration layer and data model connect them for reporting and process purposes.
Can a report automatically initiate action?
Yes. A variance or threshold breach initiates a task, request for explanation, or approval path in AMODIT or another system. A rule assigns the owner and deadline, while execution status returns to the report. Decisions that require judgment remain subject to human approval.
Does AI make decisions for management?
No. AI organizes information, identifies relationships, and prepares a recommendation. The responsible person assesses the output and approves the action. Roles, permissions, and change history maintain control over the decision process.
Where should a company start improving management work?
Choose one recurring meeting, metric, or risk where reconciling data and next steps consumes the most time. We will examine the path from source to decision, identify gaps between systems, and propose a first stage that can be extended to other areas.