
What is Power BI, and when does it work well for a company?
Power BI is Microsoft’s platform for connecting data, building semantic models, and creating and sharing interactive reports. It becomes a common analytics layer for management, finance, sales, and operations when metric definitions, data, access, and maintenance responsibilities are clearly established.
The solution is well suited when:
- every month, the controlling team combines spreadsheets from ERP, CRM, and files before preparing a management report;
- two departments show different values for the same KPI because they use different definitions or data cutoff times;
- the company is moving reporting from Excel or another platform and needs to preserve continuity for users;
- Power BI reports are already in use, but they open slowly, refreshes fail, or developing each measure requires several people;
- recipients need access based on their role, company, region, or area of responsibility.
We start with the decision the report needs to support. We then establish the sources, metric definitions, data model, publication method, and people responsible for each element.
What we do in Power BI
Reports and dashboards
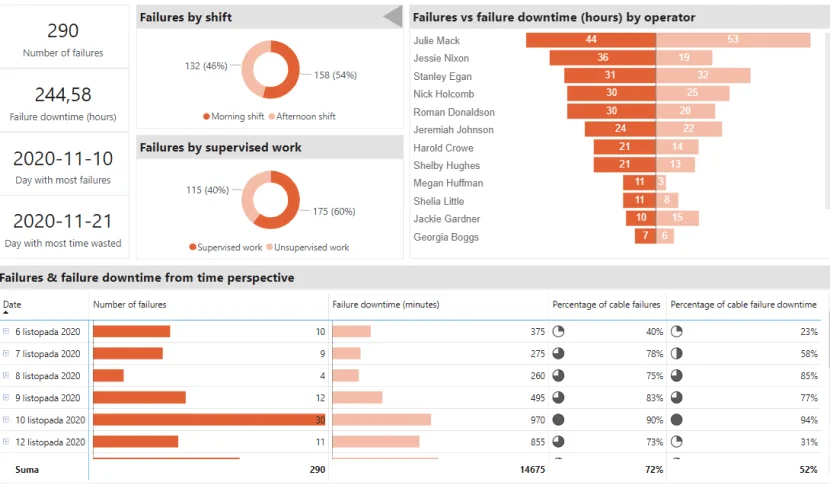
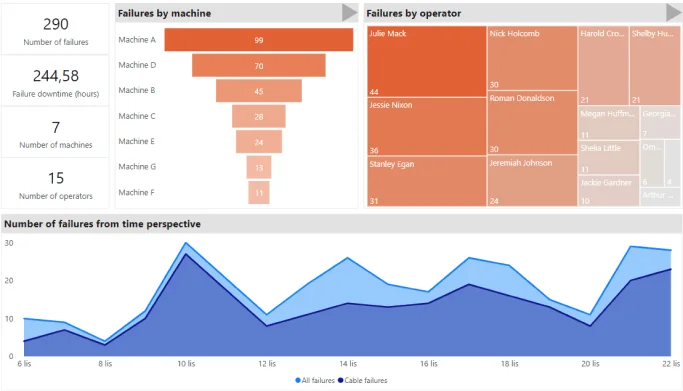
We design management, financial, and operational reports around users’ questions. We agree on KPIs, levels of detail, navigation, and how variances are presented. We verify the result with the business owner before releasing it to a wider audience.
Semantic models and data preparation
We build and organize semantic models, DAX measures, and Power Query transformations. We separate business logic from the visual layer, reduce duplicated calculations, and document the definitions needed for further development.
When sources require repeatable integration, quality control, and preparation before reporting, we connect Power BI to DataFlow or design the appropriate data layer.
Integrations and embedded analytics
We connect Power BI to ERP and CRM systems, databases, data warehouses, APIs, and files. A report runs in the Power BI service or is embedded in a portal or application. Integration also covers authentication, permissions, and the data refresh method.
Extending the client’s team
Astrafox experts lead the entire project or take over a selected stage: the data model, report, solution review, migration, or optimization. The client’s team receives documentation and a clear division of responsibility for further development.
Implementation, migration, and environment takeover
New Power BI implementation
We select the first decision-making process and a representative report. We review the data, agree on measures, prepare the model, build the report, and test the results. After approval, we configure publication, access, refreshes, and the rules for further development.
Report migration
We inventory reports, sources, calculations, permissions, and dependencies. We move critical views in stages and compare results with the source environment. A BI migration also includes a plan for switching users over and retiring unnecessary elements.
Taking over an existing Power BI environment
We assess the architecture, publication method, refresh schedules, and current issues. We organize the change backlog and take over development or SLA-based maintenance of the BI environment without restarting the project from scratch.
Power BI in Microsoft Fabric
Power BI remains the reporting and analytics layer, while Microsoft Fabric also covers data preparation, storage, and delivery. This structure is useful when report development is blocked by fragmented pipelines, multiple copies of data, a lack of shared definitions, or architecture that is difficult to maintain.
We design the semantic models, permissions, and publication of Power BI reports together with the Fabric data layer: OneLake, a lakehouse or warehouse, and Data Factory pipelines. This establishes accountability for sources, transformations, KPIs, and reports in a single implementation plan.
See Microsoft Fabric implementation and development →
Models, permissions, and data accountability
We organize the reporting model so the same measures can be used across multiple views and a definition change does not require manual updates to every report. Together with data owners, we establish a KPI glossary, update frequency, and exception-handling method.
We design access around roles and areas of responsibility. We configure workspaces, user roles, and row-level security where a recipient should see only an assigned area, company, or region. We also define who publishes reports, approves changes, and responds to refresh errors.
When Power BI reports run too slowly
A performance issue can originate in the report, model, calculations, data source, refresh process, or capacity. We analyze the entire chain instead of adjusting one visualization without identifying the cause.
The review covers model structure, DAX measures, the number and behavior of visualizations, transformations, source queries, schedules, and how people actually use the reports. The result is a prioritized list of changes. For a cross-environment diagnosis, the right place to start is the BI Optimization Assessment.
Confirmed project experience
In a completed project for an international pharmaceutical company, data in Snowflake was covered by a Power BI reporting architecture. The scope included shared KPIs, row-level security, self-service for business users, and connecting Power BI with Power Automate and Power Apps.
In other projects, we developed Power BI reports and dashboards, including financial reporting, and improved calculations in production solutions. We describe the remaining projects without client names due to confidentiality.
Frequently asked questions about Power BI
What is Power BI?
Power BI is Microsoft’s analytics platform for preparing data models, creating reports, and sharing them with users. The tool alone does not resolve inconsistent definitions or data-quality issues—these elements need to be addressed as part of the implementation project.
What does a Power BI implementation for a company involve?
We start with one business question, its recipients, and its sources. We agree on KPIs, build the model and report, verify the results, and then configure publication, permissions, refreshes, and maintenance.
Do you take over existing Power BI environments?
Yes. We inventory sources, models, reports, permissions, and the publication process. We then establish the order of repairs, development, and maintenance without automatically rebuilding the entire environment.
What is the difference between Power BI and Microsoft Fabric?
Power BI provides semantic models, reporting, and analytics. Microsoft Fabric is a broader platform that also covers data integration, processing, and storage. Power BI serves as the reporting layer of a solution built in Fabric.
How do you secure data in Power BI reports?
We design roles, workspaces, publication rules, and row-level security. Access follows each user’s responsibilities, and the solution is tested before production release.
Do you integrate Power BI with ERP and other systems?
Yes. We connect Power BI to any ERP or CRM system, databases, data warehouses, APIs, and files. The integration method depends on the available interfaces, refresh frequency, data quality, and maintenance responsibilities.