The team responds to events with context, while AI usage has a monthly budget and remains visible at all times.
Home › Cloud & Infrastructure › Cloud Command Center
Cloud Command Center · monitoring with AI agents
Fewer alerts, more answers. Continuous oversight of your cloud.
Cloud Command Center is our monitoring solution, delivered as part of our cloud maintenance and support service. Three specialized agents continuously monitor the infrastructure, explain problems, and send Microsoft Teams more than raw alerts: what is happening, why, and what to do next. The solution works on Azure, Google Cloud, and AWS.
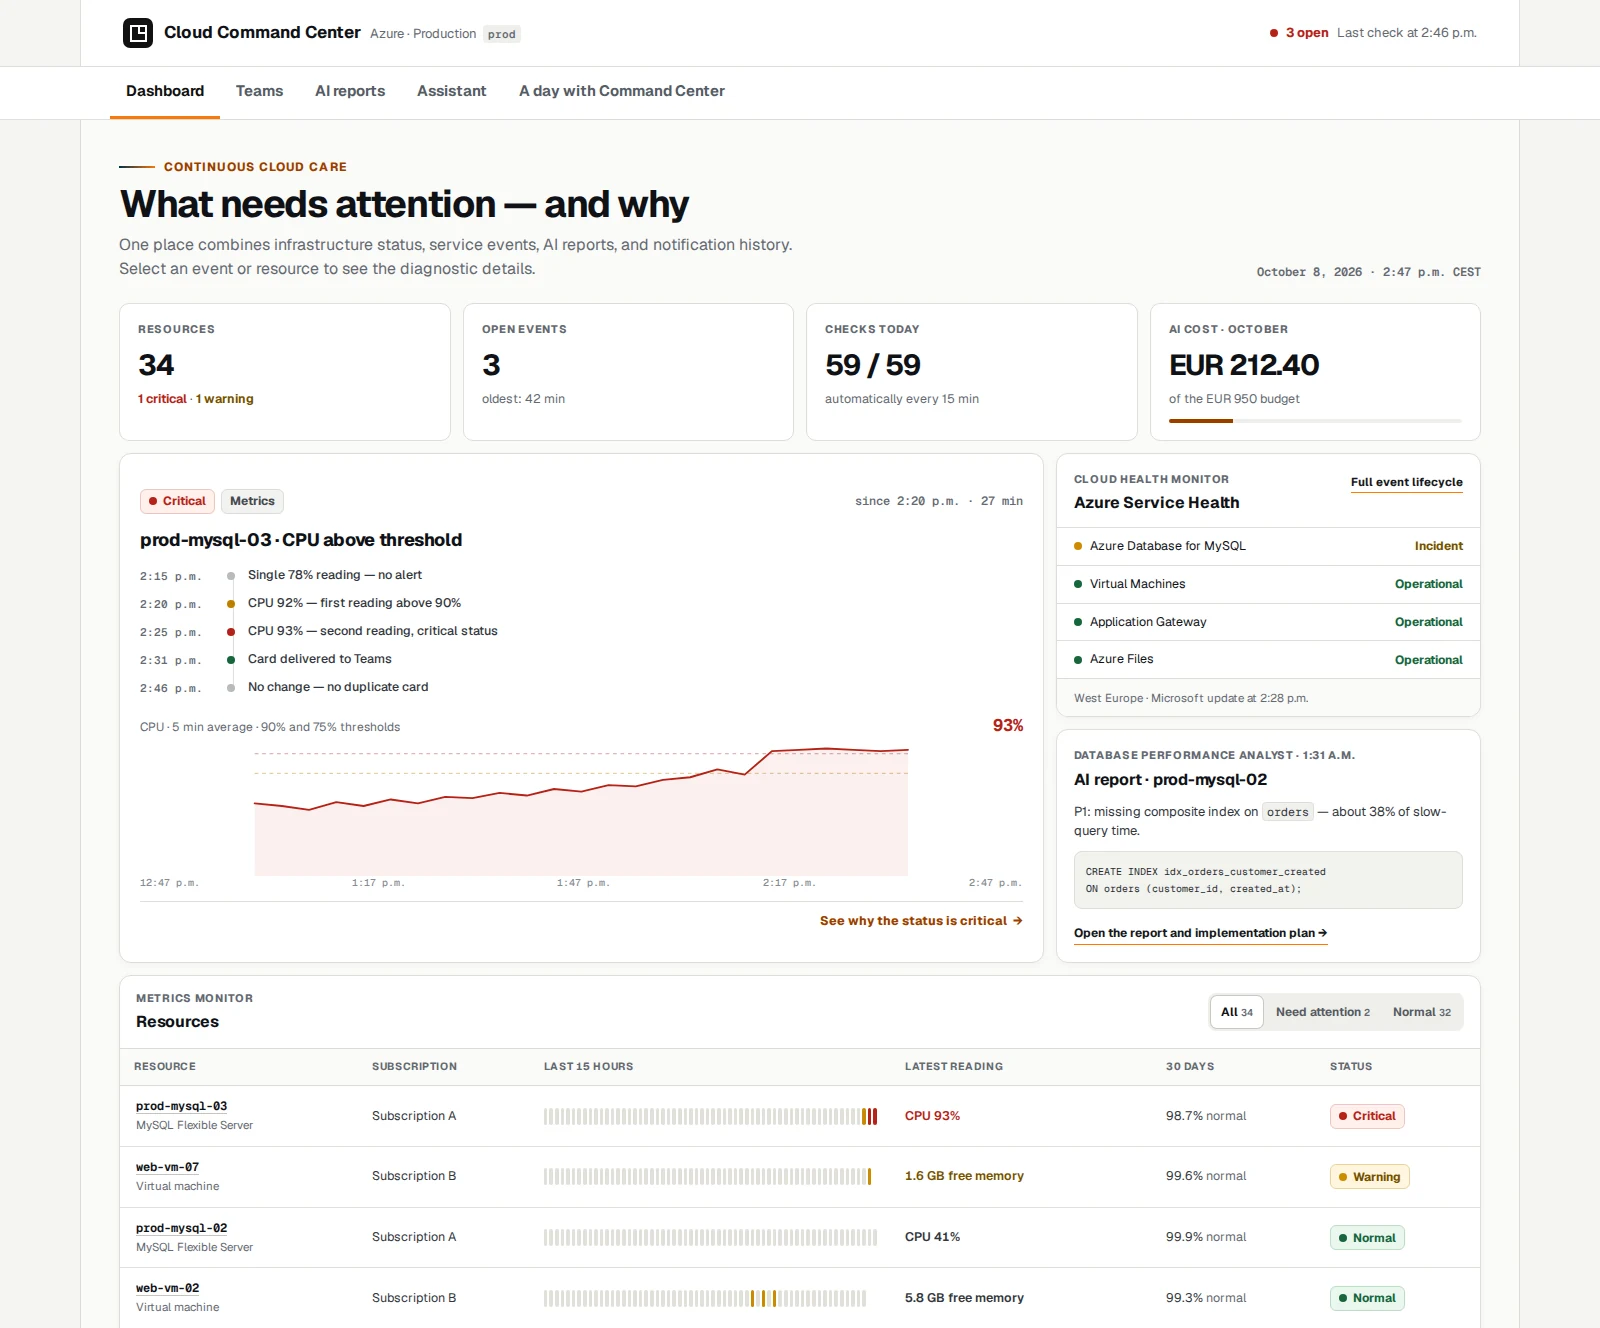
Agents track metrics and service health, analyze slow MySQL queries, maintain the history, and answer questions in Teams in read-only mode.
Problem
The cloud generates thousands of signals. The team needs answers, not another console.
Metrics, alerts, provider messages, and database logs are scattered across tools. Cloud Command Center combines continuous monitoring, fact-based rules, and AI wherever analysis requires expert knowledge.
Too much noise
Conventional alerts flood the team with notifications or remain silent when something important happens. The system confirms the problem, does not repeat a card when nothing changes, and announces the return to normal.
Too little context
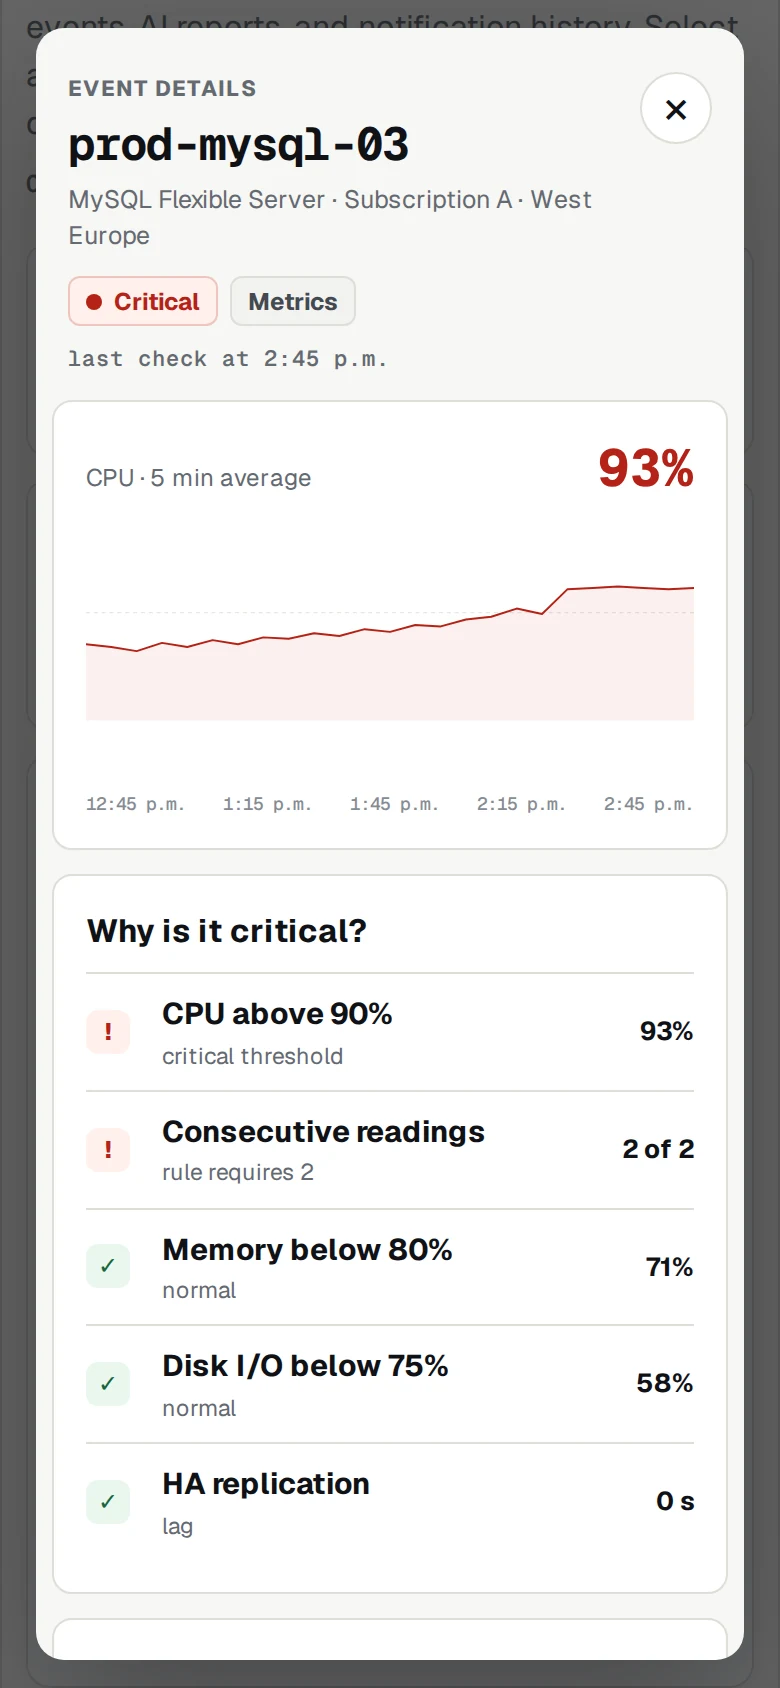
A “CPU 93%” message does not explain whether this is a temporary spike, a genuine threat, or what caused it. The Teams card shows the event, alert conditions, and next step.
Too much manual work
Reviewing portals manually and analyzing thousands of slow queries consumes experienced specialists' time. Agents collect and organize the facts and prepare a diagnosis.
Three agents and an assistant
Each monitors a different part of the cloud. Together, they provide a complete view.
The agents work continuously, and their results go where the operations team already works: Microsoft Teams and SharePoint reports.
Metrics monitor
Checks CPU load, memory, disks, connections, replication, and capacity in databases, virtual machines, networks, and file shares. It alerts after confirming a problem, publishes one card, and provides a daily summary with AI commentary.
Service health monitor
Tracks resource health, service incidents, planned maintenance, and security advisories. It filters messages to the services and regions used by the environment and follows an event from opening through updates to closure.
AI MySQL performance analyst
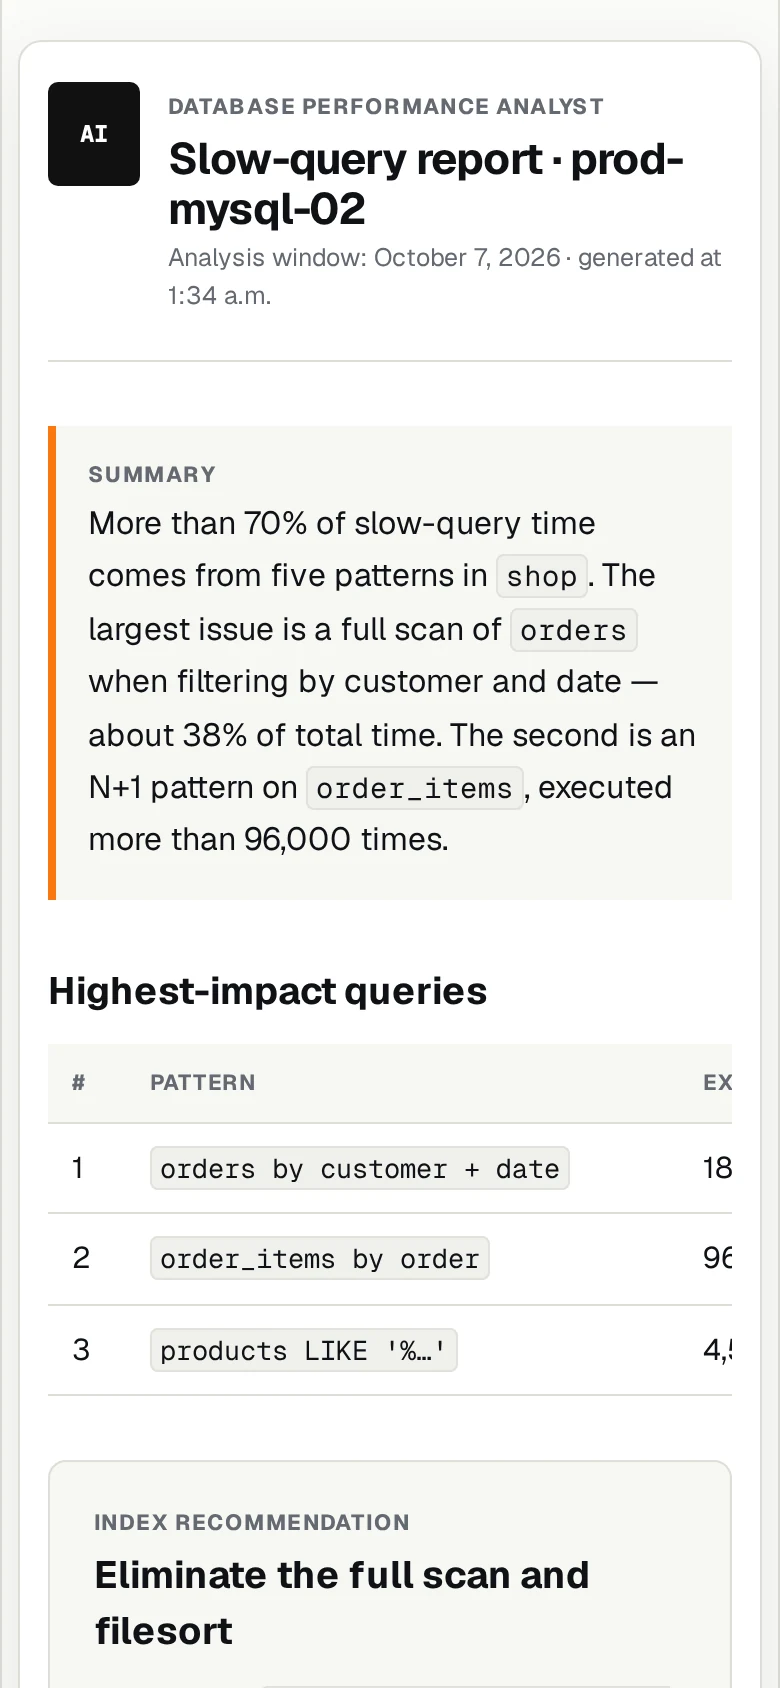
Organizes thousands of slow queries into patterns and ranks their impact. For the most important issues, it identifies the cause, fix, priority, risk, and implementation plan—including a missing index or N+1 pattern.
Assistant in Teams
Answers questions about current status, the cause of an alert, and AI usage cost based on system data. It operates solely in read-only mode and only for authorized users.
A day with Cloud Command Center
Monitoring runs continuously. The team gets a message when it matters.
The AI analyst examines databases that reported alerts the previous day and publishes a report with recommendations.
The metrics monitor checks every resource. If nothing is happening, it does not interrupt anyone.
The cloud provider reports a service incident. A card appears in Teams within minutes.
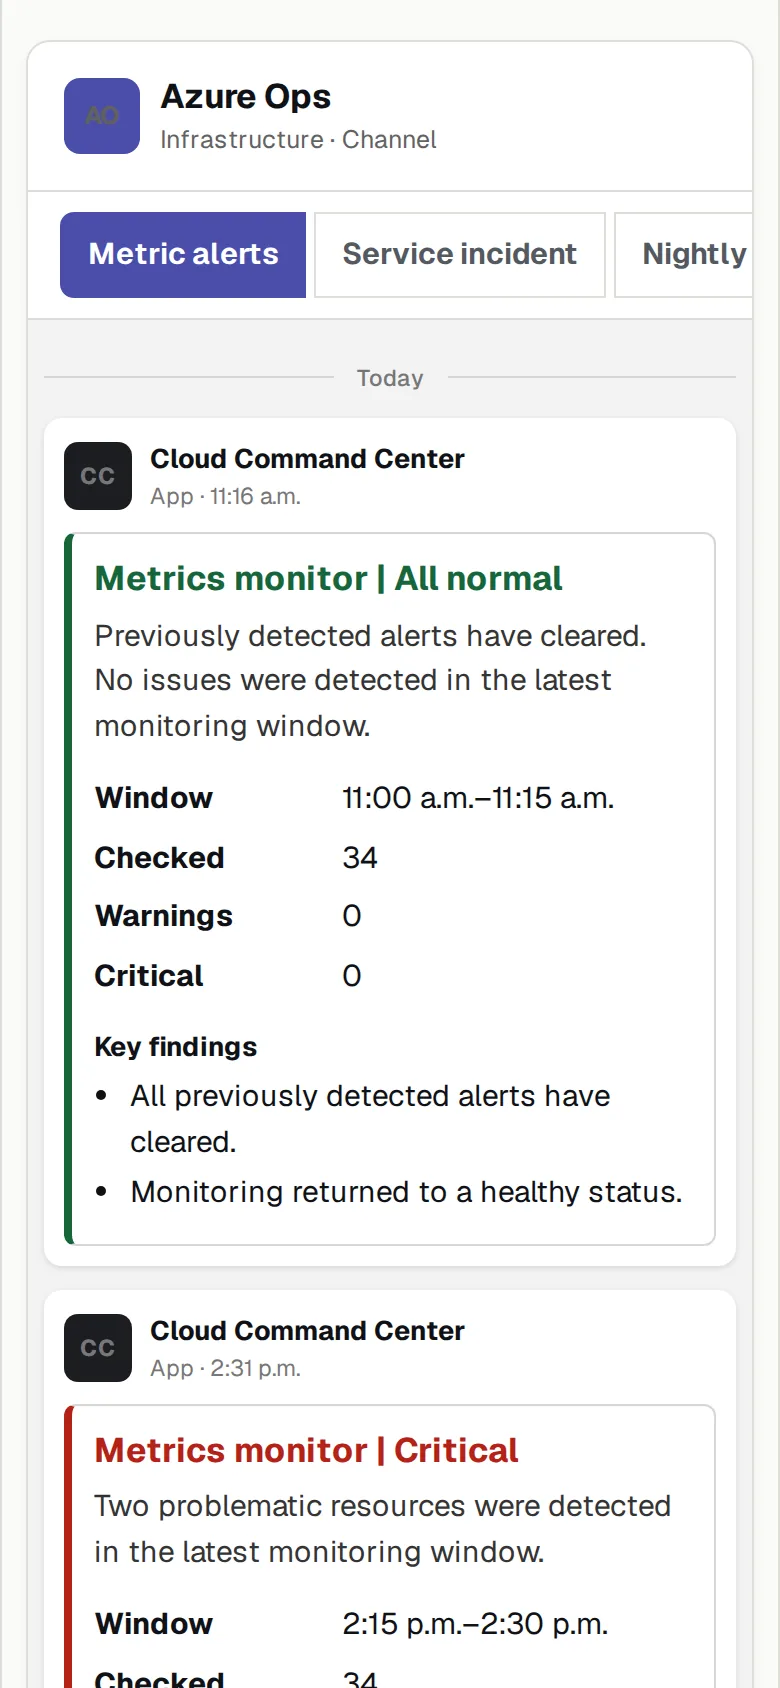
A database exceeds the load threshold twice in succession. The team receives a card with an explanation.
The status has not changed, so the system does not send another card or create noise.
The daily summary is created: checks, problems, cost, and a short AI comment.
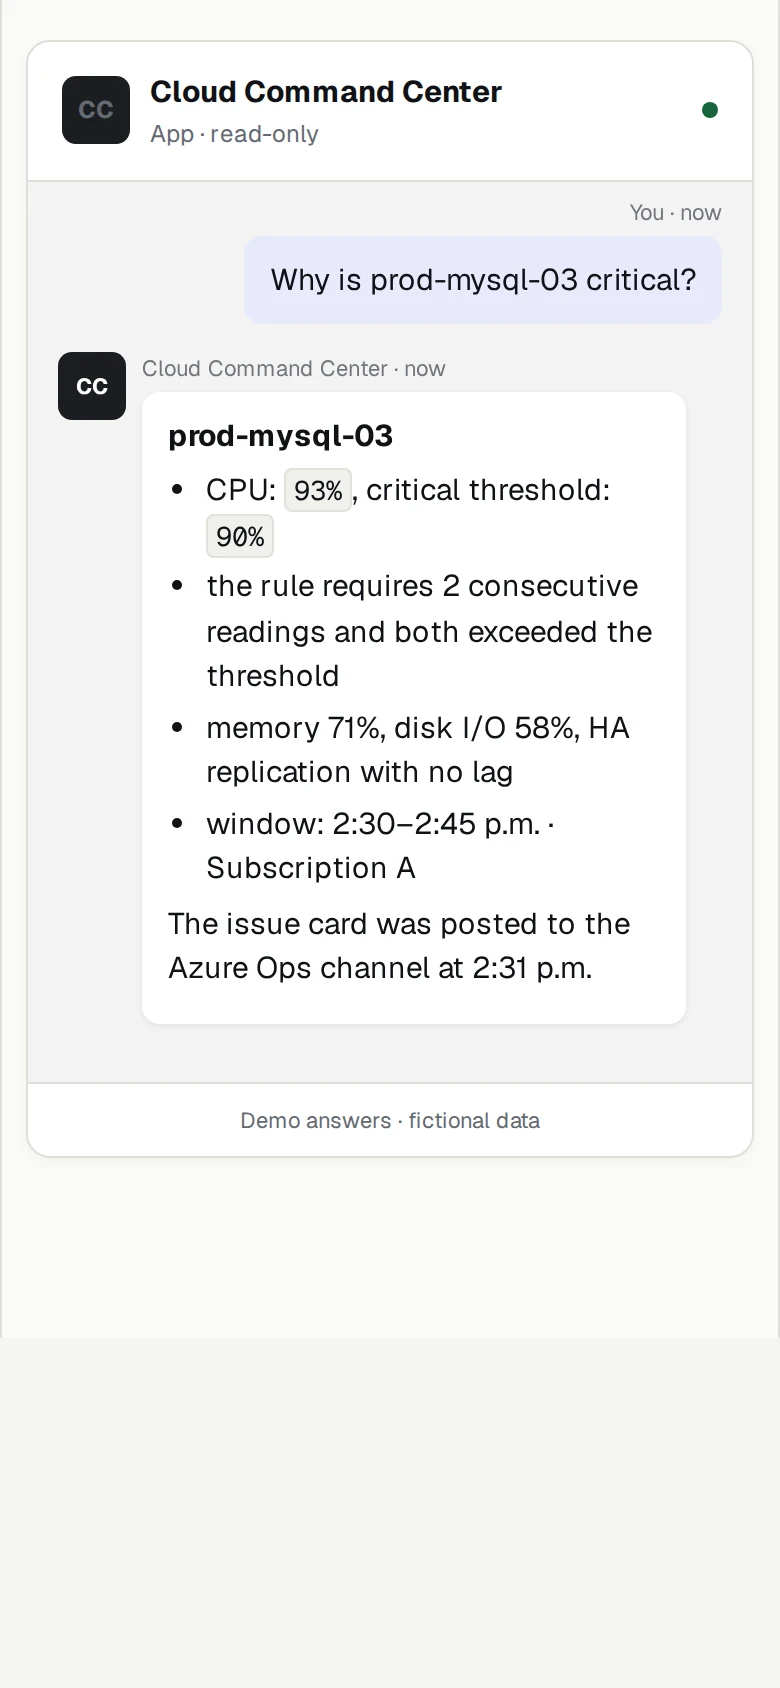
An authorized user asks the assistant in Teams and receives an answer based on current data.
Benefits
From faster response to a complete audit trail
| Benefit | What it means in practice |
|---|---|
| Faster response | The problem reaches the team within minutes, together with the cause and the conditions that triggered the alert. |
| Less noise | One card replaces a series of alerts. There are no repeats when the status does not change, and a clear message confirms the return to normal. |
| Expert knowledge every day | Nightly database performance analysis ends with organized recommendations, a priority, risk, and implementation plan. |
| More time to fix the problem | The team works on the solution instead of reviewing logs, metrics, and portals manually. |
| Predictable AI costs | AI operates within a monthly budget, and authorized users can see the daily and monthly cost. |
| Security and control | The assistant works only in read-only mode, access is restricted to authorized users, and publications remain in the history and audit trail. |
| Self-monitoring | The system also monitors its own operation. If it stops sending a heartbeat, an independent external service raises the alarm. |
In numbers
Proven in a live environment
These figures come from a monitored production environment. The data shown in the demo and screenshots is fictional.
3 + 1three specialized agents and an assistant in Teams
15 minchecks of all monitored resources around the clock, seven days a week
34 / 734 resources in seven subscriptions under continuous observation
200+incident updates handled automatically
Logical architecture
From a cloud signal to an answer in Teams
Sources provide facts, specialized agents assess their significance, and the team receives cards, reports, and answers with the history preserved.
See the system at work
From a complete cloud view to a specific fix
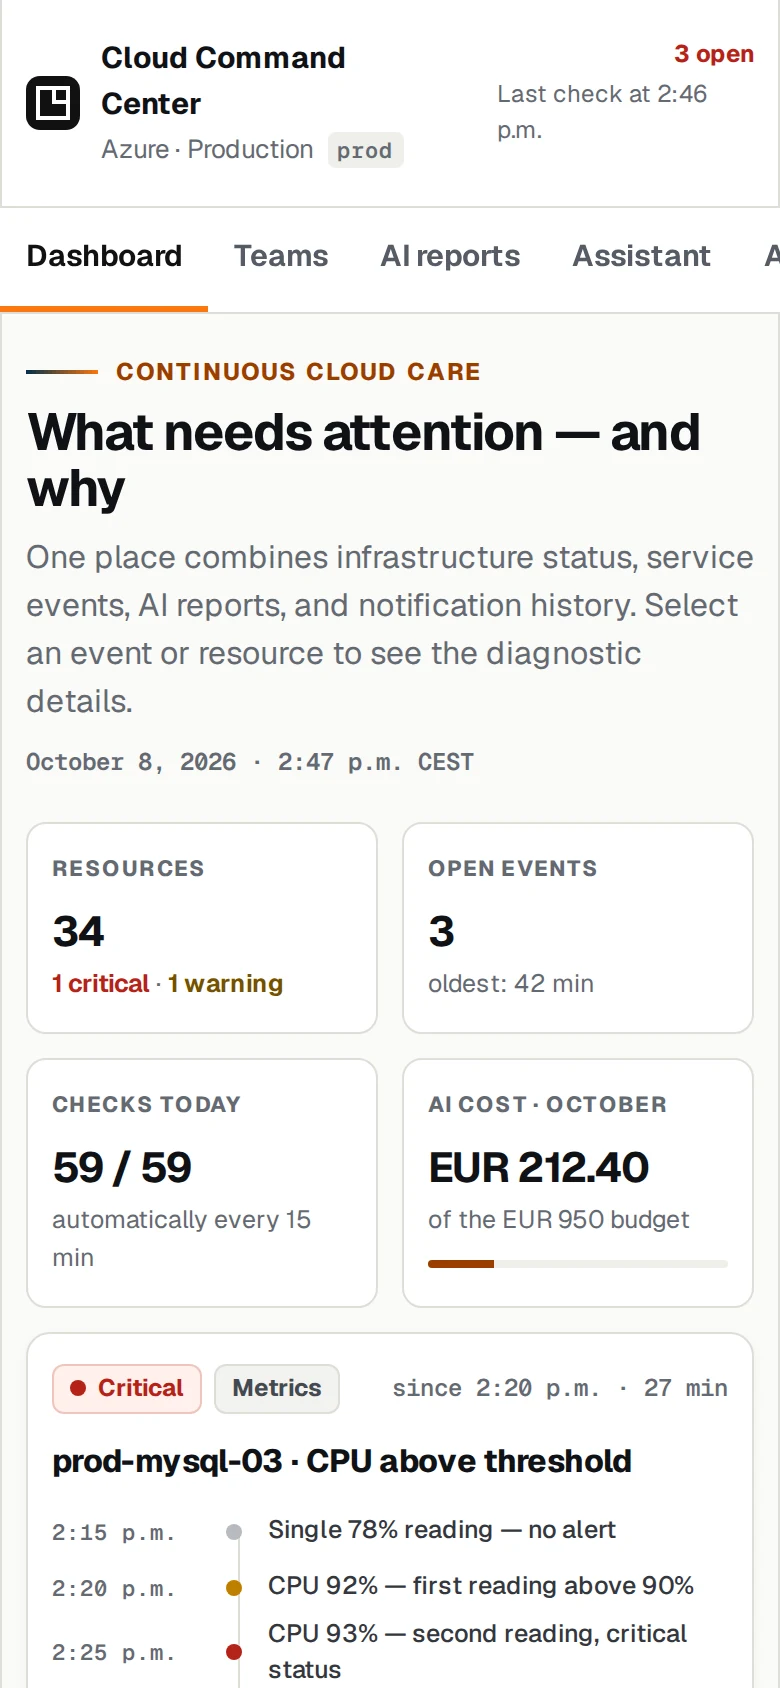
The operations dashboard is a sample visualization of data that the system already collects. Teams cards and the report reflect the current publication structure. All resource names, amounts, times, and screenshot data are fictional.
Service for your cloud
Cloud Command Center is part of our 24/7 maintenance and support service
We do not give the client another tool to monitor. We provide ongoing service for the environment: configure monitoring for its resources and thresholds, respond to events, administer the infrastructure, and develop the rules as the cloud changes. The Astrafox team is accountable for the solution and knows the environment's context.
We support Azure, Google Cloud, and AWS. We define monitored services, notification channels, and operational accountability based on the organization's architecture and needs.
Microsoft Azure
Google Cloud
Amazon Web Services
FAQ
Frequently asked questions about Cloud Command Center
What is Cloud Command Center?
It is a monitoring solution with three specialized AI agents and an assistant in Teams, delivered as part of Astrafox's cloud maintenance and support service. It monitors metrics and service health, analyzes MySQL database performance, organizes events, and provides the team with clear cards, reports, and answers.
Does Cloud Command Center work on clouds other than Azure?
Yes. The application works on Microsoft Azure, Google Cloud, and AWS. We configure signal sources, monitored resources, and rules for the client's platform and architecture. The demo and some examples show an Azure environment.
Does AI have write access to the cloud?
No. The assistant operates solely in read-only mode and only for authorized users. AI analyzes structured data and prepares recommendations, but it does not make changes to the environment.
Does the system implement recommended fixes automatically?
No. AI recommends, a person approves. The report contains the cause, proposed fix, priority, risk, and implementation plan, and an administrator reviews the proposal before making a change in the environment.
How much does AI usage cost?
We set a monthly AI budget, and every expense remains visible. An authorized user can check the daily and monthly cost in the summary or ask the assistant in Teams.
Is the data in the demo and screenshots real?
No. Resource names, SQL queries, amounts, times, and scenarios in the demo and screenshots are fictional. They are used solely to demonstrate how the solution works.
Does someone have to watch the dashboard continuously?
No. Key events, updates, reports, and returns to normal go to Microsoft Teams. The operations dashboard shown on the page is a sample visualization of data the system collects; the team does not need to watch another console.
How do we start a cloud maintenance and support engagement?
Describe the platforms in use, key services, number of environments, and current response to alerts. Based on this, we prepare the scope of monitoring, administrative accountability, and 24/7 maintenance and support.
Cloud Command Center
Put your cloud under continuous care.
We will configure monitoring with AI agents, take operational accountability, and respond to events around the clock.
Put our cloud under your care