Sustainable development and corporate social responsibility (CSR) have been promoted in the business world for many years. Although they previously served mainly an image-building role, they are now legally required. The Corporate Sustainability Reporting Directive (CSRD) took effect in Poland in 2024, and ESG (Environmental, Social, and Governance) reporting already covers the country’s largest business entities. Starting January 1, 2025, the number of companies subject to this requirement will expand progressively.
ESG reporting creates numerous challenges involving data quality, availability, standardization, and integration. Organizations also need to meet data security requirements and keep pace with a rapidly changing regulatory environment. As ESG reporting specialists, we implement the tools and processes that address these challenges, support effective data management, and maintain compliance with applicable standards.
See how CSRD and ESRS fit into our approach to security and compliance.
Key performance indicators (KPIs)
ESG reporting uses various indicators to measure and monitor a company’s sustainability performance:
-
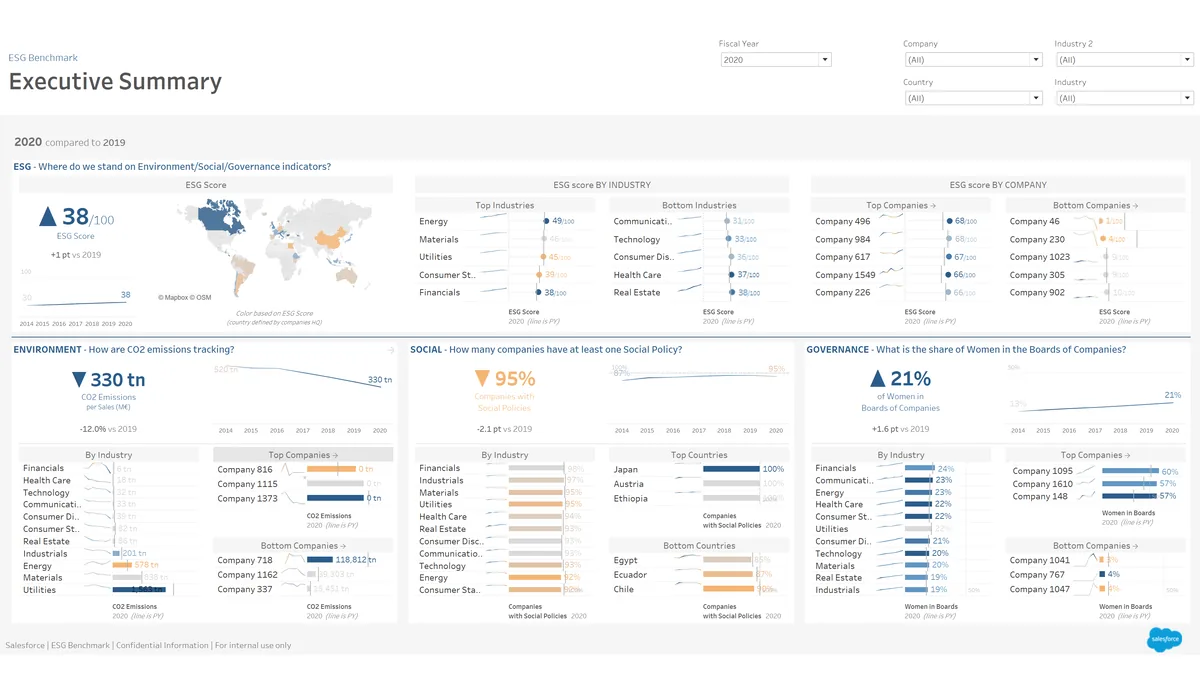
Environmental indicators: greenhouse gas emissions, energy consumption, water consumption, and waste management.
-
Social indicators: working conditions, diversity and inclusion, human rights, community engagement, and employee satisfaction.
-
Governance indicators: governance structure, ethics and compliance, transparency and reporting, risk and risk management, and anticorruption.
ESG data challenges
ESG reporting presents numerous data challenges that affect report quality and reliability:
Data quality
Data can be incomplete, outdated, or inaccurate, leading to errors in reports and decisions.
Data availability
Obtaining supply-chain data, Scope 3 emissions, or supplier working-condition data is difficult.
Data standardization
Organizations lack consistent standards and data-collection methodologies.
Data integration
Collecting data from different sources makes integration and analysis more difficult.
Data privacy and confidentiality
Data needs to be managed in accordance with personal data protection regulations.
Cost of data collection and processing
Data acquisition and analysis can involve high costs.
Technology evolution
New technologies require continuous investment.
Education and training
Employees need training in ESG data collection and analysis.
Data reliability
Verification and auditing of ESG data are essential to ensuring its reliability.
Complexity of ESG indicators
Complex indicators are more difficult to use effectively in reporting and decision-making.
Dynamic regulatory environment
Organizations need to continuously monitor changes in ESG regulations.
Stakeholder trust
Reliable data builds and maintains stakeholder trust.
Technology solutions for ESG challenges
As industry specialists, we provide comprehensive solutions for effective ESG data reporting and management. Our tools integrate, automate, and analyze ESG data, providing accurate reporting and a foundation for informed sustainability-related business decisions.
Key questions when selecting ESG reporting tools
When selecting the right ESG data analysis and reporting tools, organizations should ask the following questions:
-
Does the solution connect smoothly to multiple sources and handle large, complex data integrations efficiently?
-
Does the solution automate the normalization and preparation of sustainability data, reducing manual work and its cost?
-
Is the solution dynamic and flexible enough to adapt to changes in the ESG landscape while maintaining data governance standards?
-
Does the solution promote a culture of innovation through low-code and no-code self-service capabilities for a broad range of users, from data novices to data scientists?
-
Does the solution go beyond ESG data management to uncover and drive analytical insights for all decision-makers?
Our solutions meet all these requirements. As industry specialists, we select tools for the organization’s needs to maximize ESG data-management efficiency. We work with many technologies, including Alteryx, Python, Tableau, Power BI, Qlik Sense, and Google Data Studio. The following examples show these technologies and their ESG reporting capabilities.
ESG reporting with Alteryx
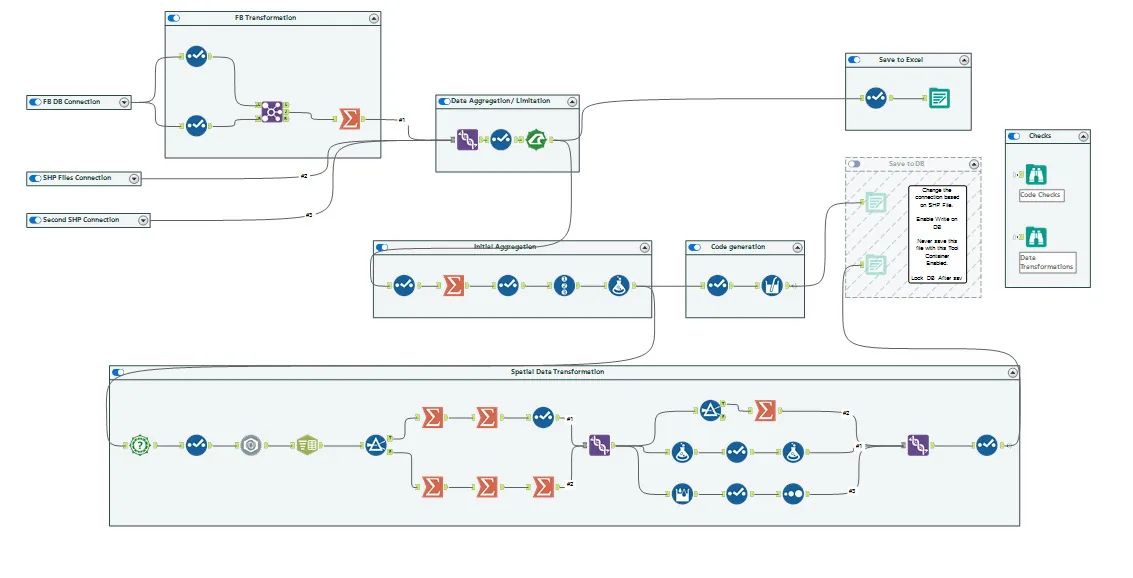
Alteryx is a no-code/low-code solution that enables teams to build and maintain a solution without advanced coding.
- Integration of data from different sources: Alteryx makes it straightforward to connect and integrate data from databases, CSV files, spreadsheets, ERP systems, and other sources. This brings all relevant information needed for comprehensive ESG reporting together in one place.
- Process automation: Alteryx provides advanced capabilities for automating analytics and reporting processes. Scheduled workflows continuously update ESG data and reports, reducing the risk of errors and increasing work efficiency.
- Advanced data analysis: Alteryx provides a broad set of tools for advanced data analysis, including statistical analysis, predictive models, and machine learning. These capabilities provide a deeper understanding of the company’s environmental, social, and governance impact, which is essential to reliable ESG reporting.
ESG reporting with Python
- Data analysis and statistics: Python provides advanced data-analysis libraries such as pandas, NumPy, and SciPy that are highly useful for processing and analyzing ESG data. These libraries support large datasets, ESG metric calculations, descriptive statistics, and advanced analyses.
- Data visualization: Libraries such as Matplotlib, Seaborn, and Plotly produce clear, engaging ESG data visualizations. Bar, line, and pie charts and heatmaps present ESG data in a way that is understandable and persuasive to different stakeholders.
- Modeling and forecasting: Python is also used to build predictive models and forecasts, which are important when analyzing the effect of ESG activities on an organization’s financial and operational performance. Libraries such as scikit-learn and TensorFlow support machine learning models that forecast future trends and assess ESG-related risks.
Python also complements Alteryx when additional capabilities are needed for data collection and processing.

ESG reporting with Tableau
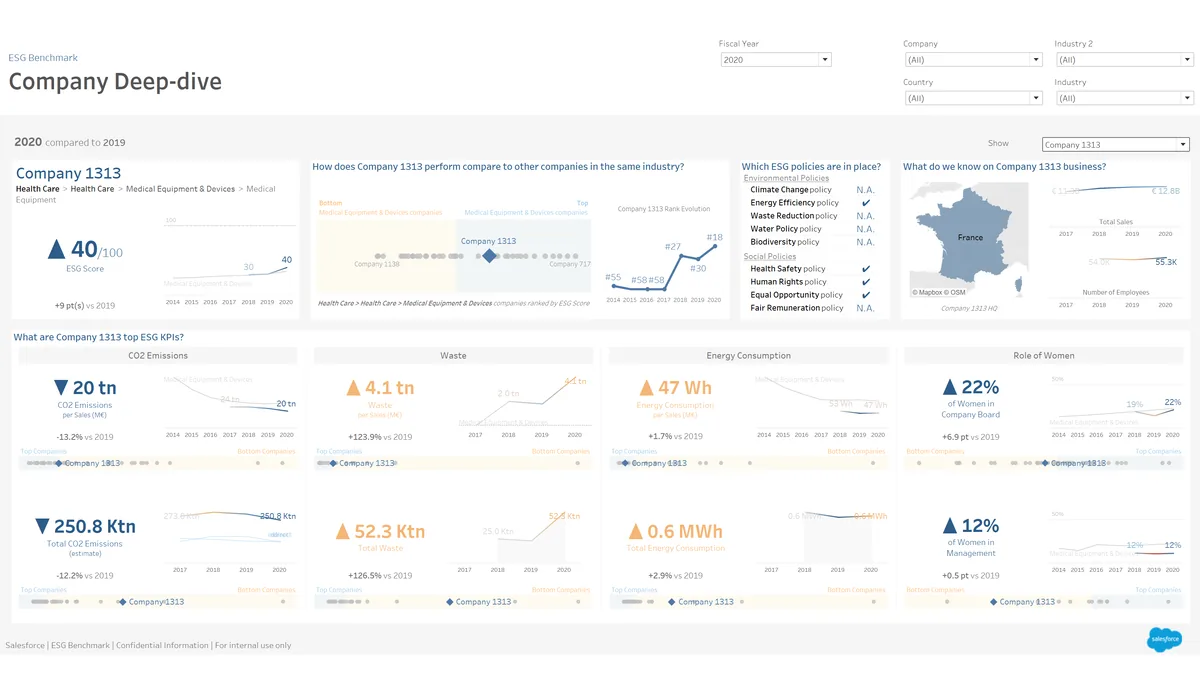
- Advanced data visualization: Tableau provides advanced tools for creating intuitive, interactive, and visually polished presentations. These capabilities make complex ESG data accessible and understandable, simplifying analysis and interpretation of key indicators.
- Integration with different data sources: Tableau integrates data from databases, spreadsheets, ERP systems, data clouds, and other sources. Consolidating ESG data in one place is essential to comprehensive and consistent reporting.
- Interactivity and data exploration: Tableau allows users to interact with data by clicking, filtering, and exploring visualization elements. This interactivity supports in-depth ESG data analysis, trend discovery, and identification of areas requiring attention, providing a foundation for informed decisions.
ESG reporting with Microsoft Power BI
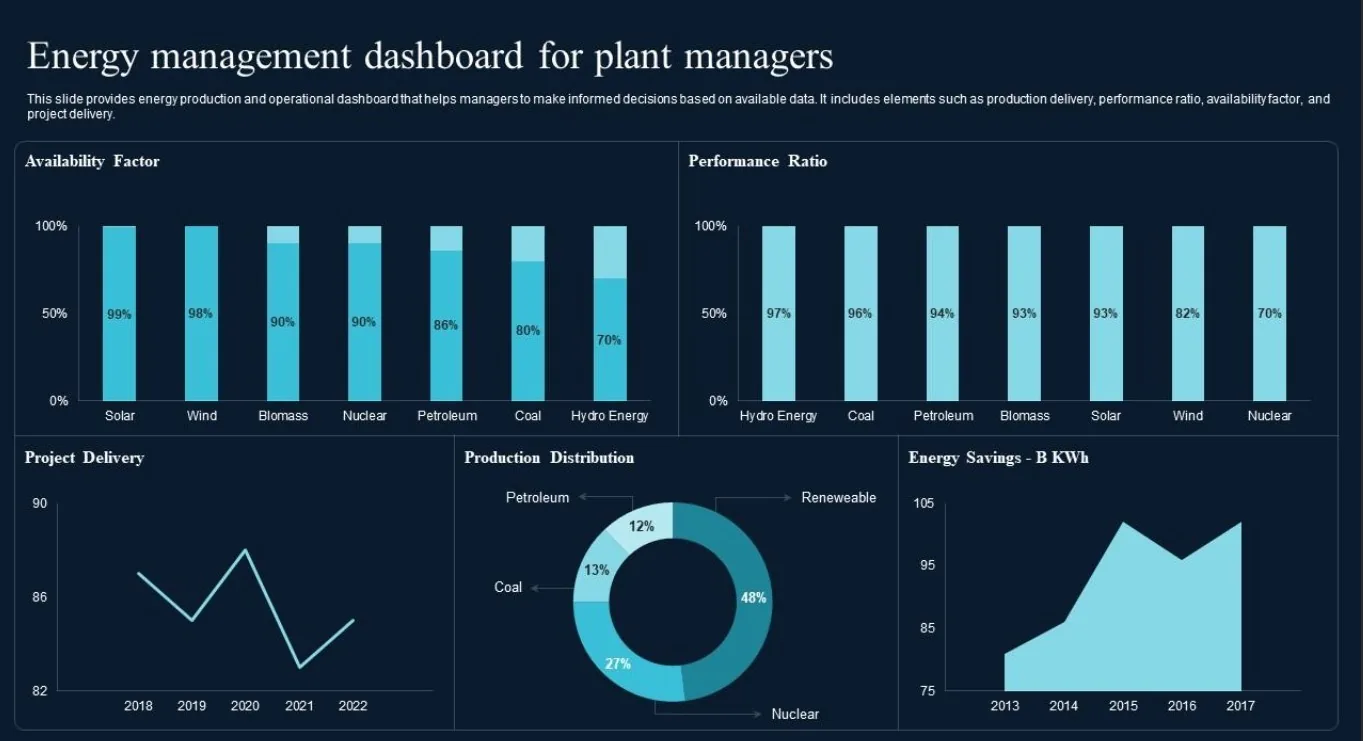
- Advanced visualizations and dashboards: Power BI provides a broad set of advanced tools for creating interactive data visualizations and dynamic dashboards. ESG data is presented clearly in graphical form, simplifying analysis and communication of results.
- Integration with different data sources: Power BI integrates data from databases, Excel files, cloud services such as Azure and AWS, and other business applications. This enables efficient collection and consolidation of ESG data from different systems into one consistent source of information.
- Advanced analytics and data modeling: Power BI supports advanced data analysis, including trend analysis, forecasting, and advanced predictive models. These capabilities provide a deeper understanding of ESG data and identify the key indicators and trends affecting the organization.
Summary
ESG data management requires a strategic approach and the right technology tools. Alteryx, Python, Tableau, and Power BI streamline ESG data collection, integration, and analysis, giving companies more effective reporting and a sound basis for decisions. Investment in these technologies is essential to an organization’s long-term success and sustainable development.
We provide support throughout the process to make it as straightforward as possible. Our experience and specialist knowledge allow us to select the right tools for the organization and maximize ESG data-management efficiency. We provide comprehensive support, from technology selection through implementation and employee training, to establish effective data management and accurate ESG reporting.
What is ESG?
ESG (Environmental, Social, and Governance) is a set of assessment criteria that measures how an organization operates in relation to sustainability and social responsibility. ESG covers environmental, social, and governance factors.
Why is ESG important?
ESG is important because it allows organizations to understand and manage their effect on the environment, society, and governance. Following ESG standards increases stakeholder trust, improves a company’s reputation, and attracts investors interested in sustainable development.
When did ESG reporting become mandatory?
Mandatory ESG reporting in the European Union stems from the Non-Financial Reporting Directive (NFRD), which has applied since 2018. The Corporate Sustainability Reporting Directive (CSRD) was introduced in 2021, expands the scope of ESG reporting, and has applied since 2024.
What are the most important ESG indicators?
The most important ESG indicators include:
· Environmental indicators: greenhouse gas emissions, energy consumption, water consumption, and waste management.
· Social indicators: working conditions, diversity and inclusion, human rights, community engagement, and employee satisfaction.
· Governance indicators: governance structure, ethics and compliance, transparency and reporting, risk and risk management, and anticorruption.
Which tools can be used to analyze ESG data?
Tools such as Alteryx, Python, Tableau, and Power BI can be used to analyze ESG data. Each provides advanced data integration, automation, and analysis capabilities.
What are the main ESG reporting challenges?
The main ESG reporting challenges are data availability and quality, integration of data from different sources, data standardization and security, changing regulations, and stakeholder expectations.
What benefits does ESG reporting provide?
ESG reporting provides benefits such as better risk management, greater investor and stakeholder trust, an improved company reputation, identification of opportunities for higher operating efficiency, and better preparation for future regulations.
What are the costs of implementing ESG systems?
The costs of implementing ESG systems include investment in data-collection and analysis technologies, employee training, expert consulting, audits, and certification.
What are the best practices in ESG reporting?
Best practices in ESG reporting include regular data updates, recognized reporting standards such as GRI and SASB, transparent communication, stakeholder involvement in the reporting process, and continuous improvement of data-collection and analysis processes.
How should a company prepare for ESG reporting?
To prepare for ESG reporting, a company needs to identify its key ESG indicators, establish systems for collecting and analyzing data, train employees, maintain regulatory compliance, engage stakeholders, and regularly update and publish ESG reports.