
Reports for teams working in the Google ecosystem
We connect data sources, align metric definitions, and design reports available in a browser. We also develop existing dashboards, improve their clarity and performance, and embed them in websites, portals, and intranets with appropriate access controls.
Google Data Studio (known as Looker Studio from 2022 to 2026) is used to create interactive reports and dashboards available in a browser. It connects data from different sources and lets organizations share reports tailored to each audience’s questions and responsibilities.
When Google Data Studio makes sense
Data Studio is a good choice for organizations using the Google ecosystem, marketing teams, and projects where a clear report needs to be prepared quickly. For more complex requirements, we design the solution around the data, security, scale, audience, and maintenance model.
What we do
- connect data sources and organize how they are fed into the reporting environment;
- design reports and dashboards that answer specific business questions;
- develop existing reports and advise on their performance and clarity;
- embed reports in a website, portal, or intranet.
We start by establishing who uses the report, which decisions it needs to support, and where the data comes from. This ensures that the work goes beyond arranging charts.
Google Data Studio capabilities
Browser-based report editor
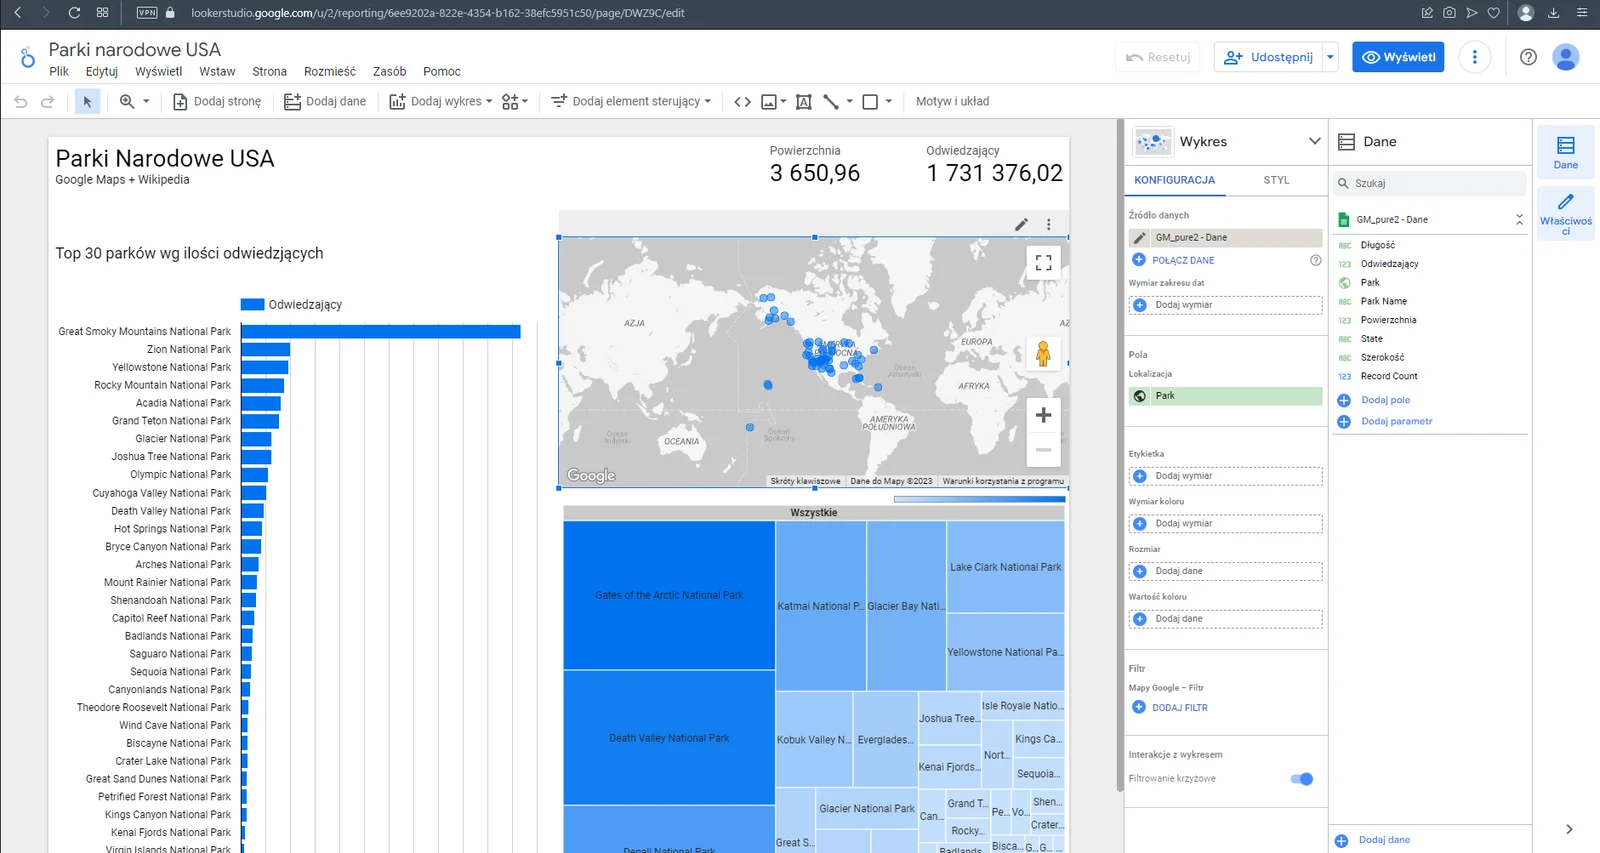
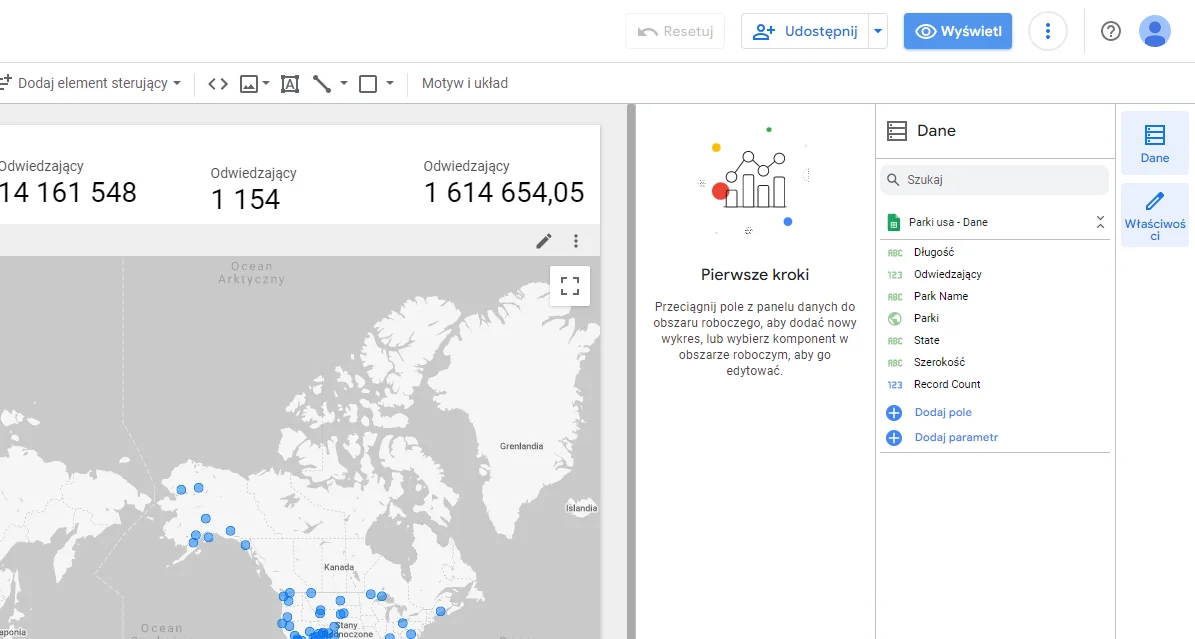
Reports are created using drag and drop. Dashboard elements can be arranged on a grid, formatted, and aligned with the organization’s visual identity.
Report templates
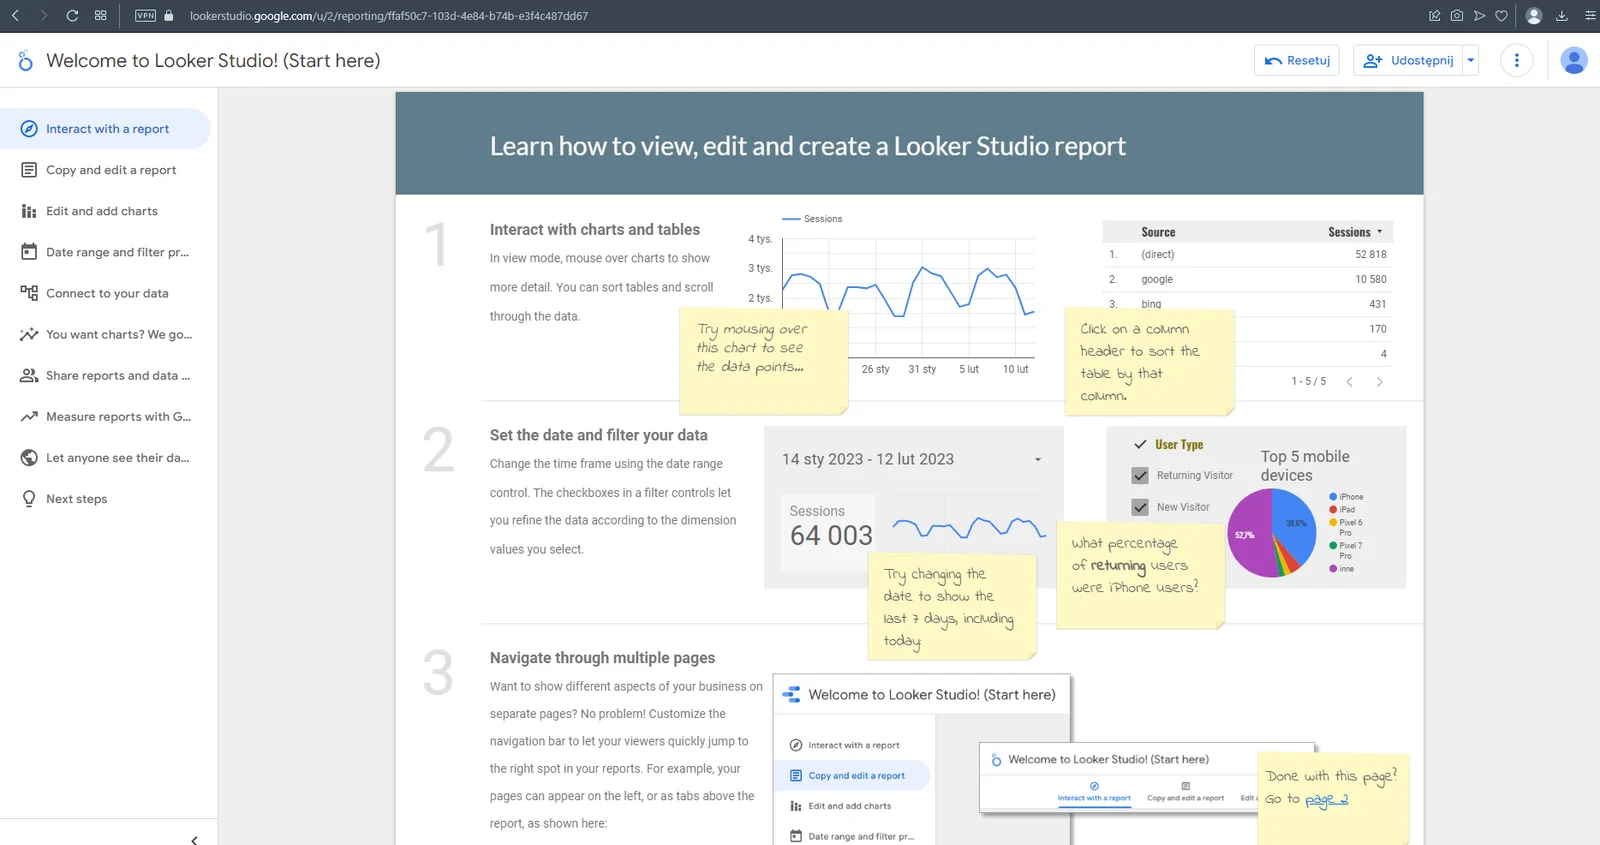
Templates provide a faster start when working with a known data source. We treat them as a starting point—the metrics, filters, and layout still need to match the audience’s needs.
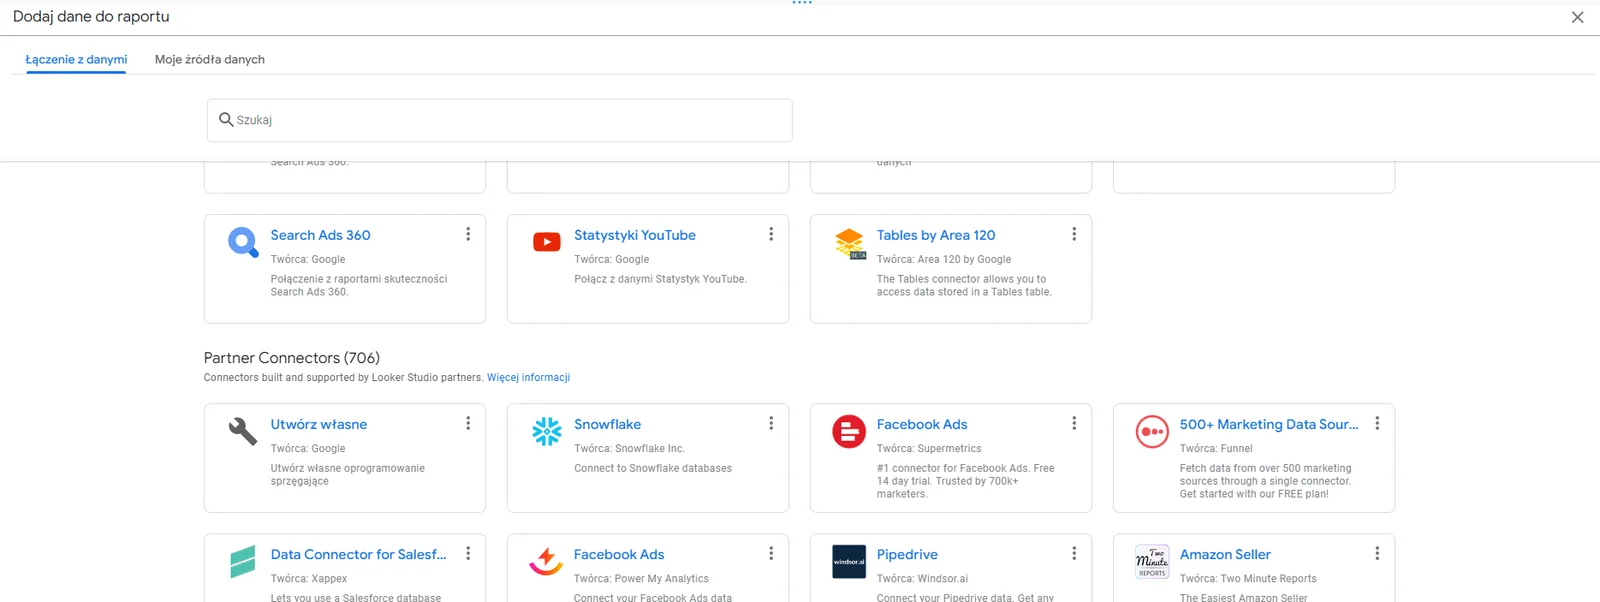
Data connectors
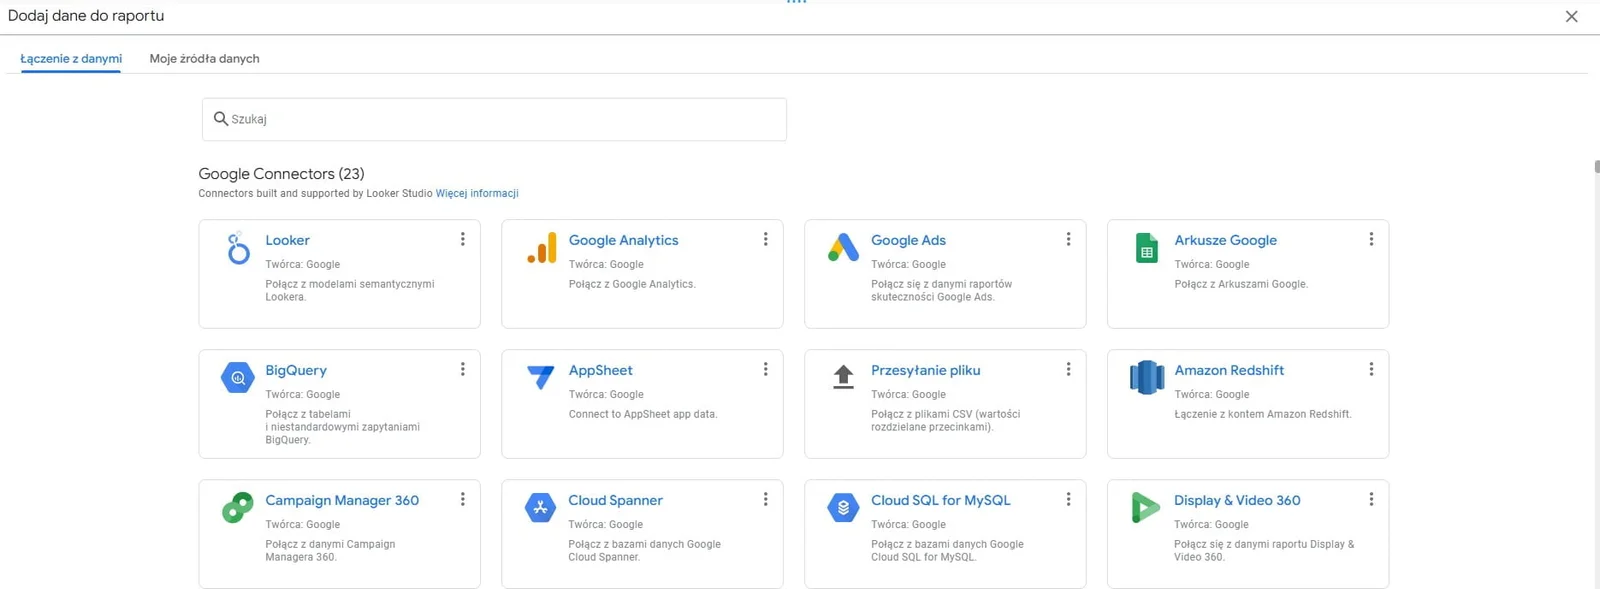
Ready-made connectors make it easier to connect reports to sources in the Google ecosystem and other systems. When a standard connection is insufficient, we assess an additional integration or prepare the data before reporting.
API and asset management
The Data Studio API supports the automation of selected activities involving Data Studio assets in organizations that use Google Workspace or Cloud Identity. We tailor the automation scope to the environment’s permissions and governance rules.
Report embedding
We embed reports in websites and intranets. Before implementation, we establish access rules, data scope, and the method used to authenticate recipients.
How we start
We begin by selecting one report or business question, reviewing the sources, and aligning metric definitions. We then prepare the view, validate the results with the data owner, and establish the maintenance model.
Frequently asked questions about Google Data Studio
Are Google Data Studio and Looker Studio the same tool?
Yes. This reporting tool was developed under the Looker Studio name from 2022 to 2026 and then returned to the Google Data Studio name. The former name still appears in documentation, search queries, and user conversations.
Which sources can Data Studio connect to?
Ready-made connectors cover Google services and many external databases and applications. Before implementation, we review authentication, refresh frequency, data quality, and accountability for the connection.
Can a Data Studio report be embedded in a portal or intranet?
Yes. Embedding requires decisions about who can see the report, how authentication works, and which data each audience can access.
When is a broader data or BI platform needed?
A broader platform is needed when reporting involves many complex sources, extensive access management, shared models for multiple teams, or demanding maintenance processes. In that situation, we assess the end-to-end data pipeline and select the right architecture instead of expanding one dashboard indefinitely.
If the issue affects the entire reporting environment, start with the BI Optimization Assessment. For data sources that are combined manually, see DataFlow.