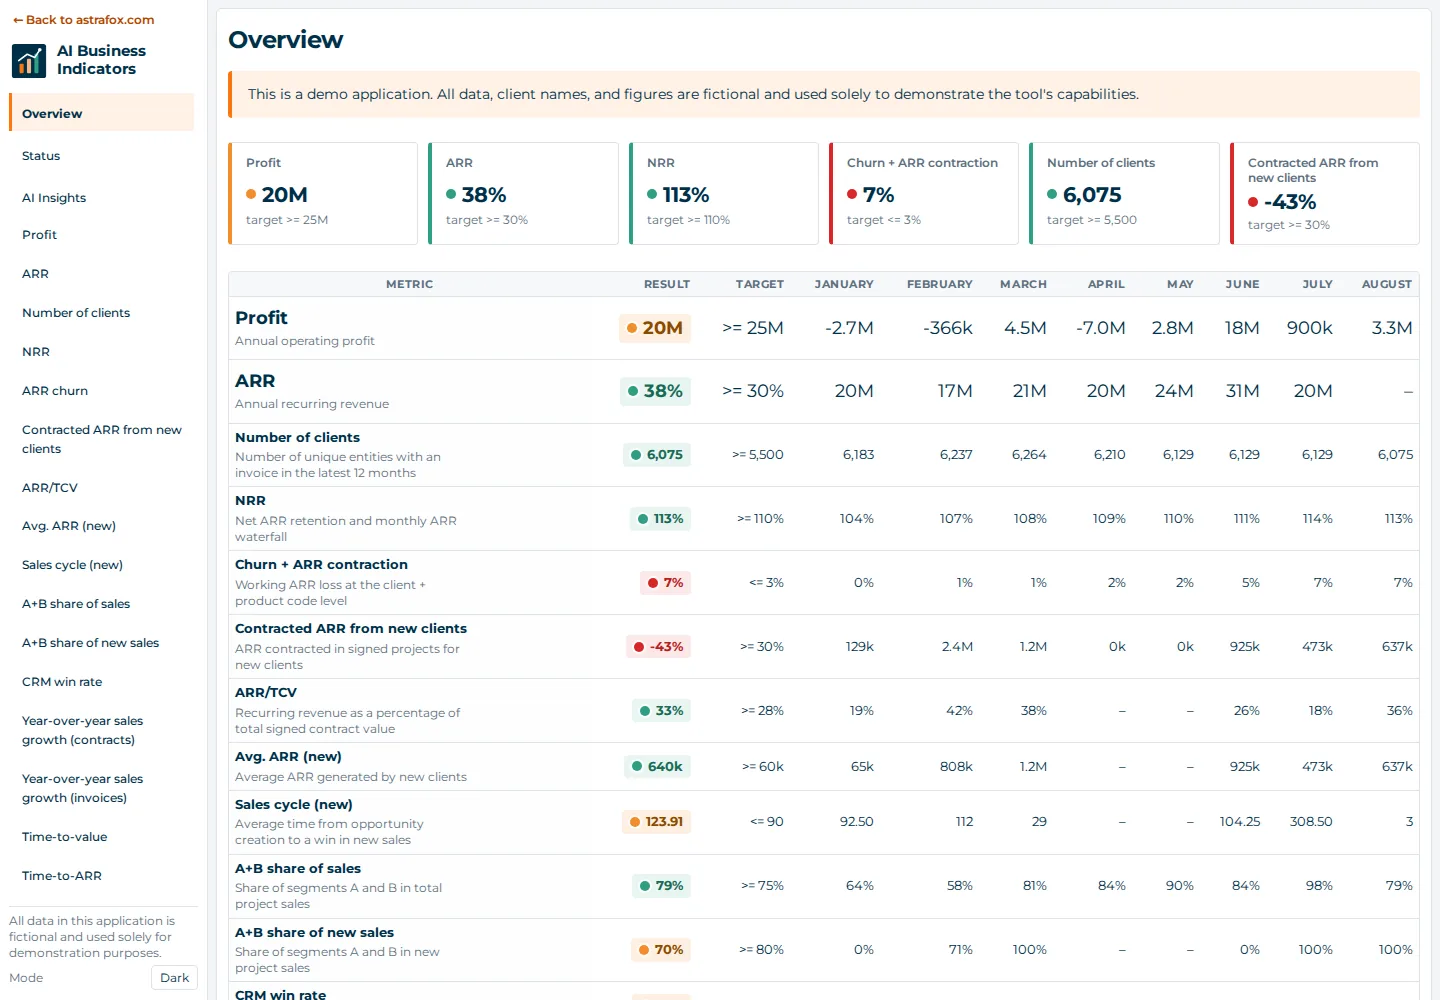
We built AI Business Indicators so management teams and people responsible for company performance can continuously track strategic key performance indicators. The data comes from systems the company already uses, and the figures are accompanied by analysis prepared by AI. We adapt the product to the client’s business, KPIs, and source systems.
Below, we explain where the idea came from and how it changes the way companies work. A full description of the application and its scope is available on the AI Business Indicators page.
Does this morning before a management meeting sound familiar?
The CFO opens a spreadsheet and begins pasting data from the CRM, accounting system, and ERP. Sales sends its version of the figures, while the implementation team sends another. After several hours, the presentation is ready, and the first question in the meeting is, “Where did this number come from, and why is it different from last month’s?” Answering it requires reconstructing the entire report.
Some companies rely only on spreadsheets and presentations. Others already have BI and reporting in place, but their strategic KPIs still sit in several locations. No one combines them into a single view of the company’s health or explains what that view means.
In this situation, the company spends time preparing data, while management discusses which figures are correct instead of what they mean. The risk is twofold: decisions are delayed or based on KPIs that no one fully trusts.
What we do with the client
AI Business Indicators was created to shorten the path from data in systems to decisions. We follow several steps with the client:
- Define the KPIs. We start with management’s questions, not charts: what does the company need to see in order to run the business, and which objectives sit behind each measure? The product’s ready-to-use knowledge of strategic KPIs supports this work.
- Connect the data. The application retrieves data from databases, warehouses, data platforms such as Snowflake and BigQuery, and directly through APIs from business systems such as CRMs and ERPs. It does not require a BI engine such as Power BI, Tableau, or Qlik.
- Adapt the application to the company. We tailor the KPIs, definitions, and objectives to the business, and AI makes this process fast.
- Add AI analysis. In addition to charts, the user receives insights: an assessment of the situation, strengths, threats, and recommendations for departments.
- Verify the results with the client. We compare the figures with existing reports before management begins using the tool.
We set the refresh frequency for the data and insights with the client according to its sources and needs.
Why it matters
From the company’s perspective, the change concerns time and trust in the figures:
- Less manual work. People who currently assemble reports can focus on interpreting them.
- One version of the figures. KPIs use consistent definitions, so the meeting does not begin with a dispute about the data.
- Confidence in where the result came from. Every figure can be traced back to source records, so the question “how do we know?” does not block a decision.
- Earlier signals. A deviation from a target is visible immediately rather than in the next monthly report.
- A discussion about action. AI insights indicate which areas teams should address first, and management decides what to do.

An example from the demo version: the net revenue retention (NRR) metric and a waterfall chart show what drove the change in recurring revenue.
We treat AI insights as a proposed analysis. AI recommends, and a person reviews and decides. This is why every figure must remain traceable.

See how it works
We prepared a demo using sample data for a B2B SaaS subscription company. All data is fictional. Open the AI Business Indicators demo to review the KPIs, methodology, and AI insights. If reporting data is currently prepared manually, our DataFlow platform also organizes it from source systems.
Which KPIs does your management team need to see? Describe what you currently assemble manually and which systems supply the data. We will define the scope of the first version. Describe your KPIs →