Why automate sales and distribution reports?
Margin falling? A promotion not working? Before Excel even opens, the competition is already changing its strategy. That is why we build sales and distribution dashboards for people who cannot wait—sales directors, category managers, and trade marketing specialists. These solutions serve teams that have had enough of delayed reports and manual data analysis. Instead of guessing, we show where the company actually earns money—and where it loses it.
Reports and dashboards we build
Retail sales report
A clear dashboard presenting results in the retail channel. It includes sell-out data, sales value, volumes, and margins by store, product, and period, enabling rapid analysis of commercial performance.
Benefits:
- Rapid sales performance analysis
- Better inventory and promotion management
- Early identification of problems across the sales network
Distribution and product availability report
An interactive report showing product availability and turnover. It supports logistics planning and minimizes stockouts. It includes low-availability alerts and inventory analysis.
Benefits:
- Optimal inventory levels
- Automatic stockout alerts
- Higher logistics efficiency
Product margin report
An analytics report showing unit and total margins by product, channel, and client. It identifies unprofitable areas and supports decisions about optimizing the offering.
Benefits:
- Identification of unprofitable product lines
- Pricing policy optimization
- Higher sales profitability
Sales report by distribution channel
A comparison of sales results across online, wholesale, and retail channels. It supports analysis of each channel's share, identification of trends, and sound strategic decisions.
Benefits:
- Monitoring each channel's share of sales
- Faster decisions on support for specific channels
- Better campaign and distribution planning
Price promotion dashboard
A report analyzing the effect of discounts and promotions on sales and margin. It shows how promotional activities affect results and supports optimization of marketing plans.
Benefits:
- Better promotion planning
- Higher return on promotional activities
- Marketing budget optimization
Key account sales report
Presents sales, order frequency, and changes in sales with the company's largest business partners.
Benefits:
- Stronger commercial relationships
- Early identification of declining sales
- Support for negotiations and retention activities
Wholesale report
A dashboard presenting wholesale channel results by client and product category.
Benefits:
- Wholesale client segmentation
- Faster response to changes in demand
- Support for sales representatives
Sales KPI dashboard
A clear report presenting key sales performance indicators, including the number of transactions, average basket value, and conversion rates.
Benefits:
- Real-time performance monitoring
- Sales team motivation
- Support for achieving quarterly and annual targets
Sales team performance report
A report comparing the results achieved by individual sales representatives and teams.
Benefits:
- Identification of best practices
- Personalized development programs
- Greater team motivation
Product turnover analysis dashboard
A report showing how quickly products move through warehouses and points of sale, supporting logistics and inventory decisions.
Benefits:
- Lower risk of product expiration
- Better inventory management
- Optimized deliveries and production
Why choose Astrafox?
- A complete 360-degree view—we combine sell-in, sell-out, promotional budgets, inventory levels, and sales targets in one KPI model covering uplift, ROI, ACV, and OSA.
- Experience and mockup-based work produce a record-short implementation time—the first dashboards are ready in five to seven business days instead of two months.
- Alerts, not reports—automatic notifications flag declining margins, shelf stockouts, and promotional budget overruns.
- Industry experience—we have worked for FMCG, pharmaceutical, DIY, and retail companies and know which metrics drive sales in each channel.
- Visualization best practices—we design reports in line with IBCS and clear data-storytelling principles, enabling faster, more confident decisions.
- Collaborative work and full transparency—regular consultations, real influence over the project, and no black boxes.
- A flexible fit for needs and budget—we provide tailored solutions at every scale, with a dedicated consultant on the client’s side.
Which technologies do we use for sales and distribution reports?
We build reports and dashboards with leading Business Intelligence tools. We use solutions that combine intuitive operation, flexibility, and secure data handling. We always select the technology for the client’s organizational needs, infrastructure, and budget.
- Power BI—a leader in business analytics
Microsoft’s solution provides fast connections to different data sources, automatic report refreshes, integration with the Microsoft ecosystem, including Azure, SharePoint, and Teams, and extensive DAX-based analysis capabilities.
- Tableau—a standard for data visualization
The platform is valued for its advanced graphics, map and geospatial data support, straightforward drag-and-drop interface, and integration with data warehouses and cloud platforms such as Snowflake and BigQuery.
- Amazon QuickSight—analytics in the AWS cloud
A flexible BI tool with a pay-per-session pricing model, integrated with the AWS ecosystem. It enables rapid dashboard sharing and the use of machine learning-based predictive capabilities.
- Looker—modeled reporting in Google Cloud
A LookML-based platform that establishes consistent business logic across the organization. It supports data exploration by end users and integration with BigQuery.
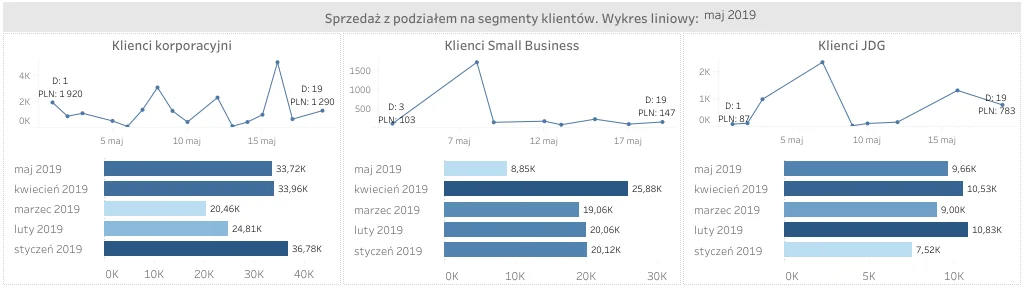
Example sales report by client segment
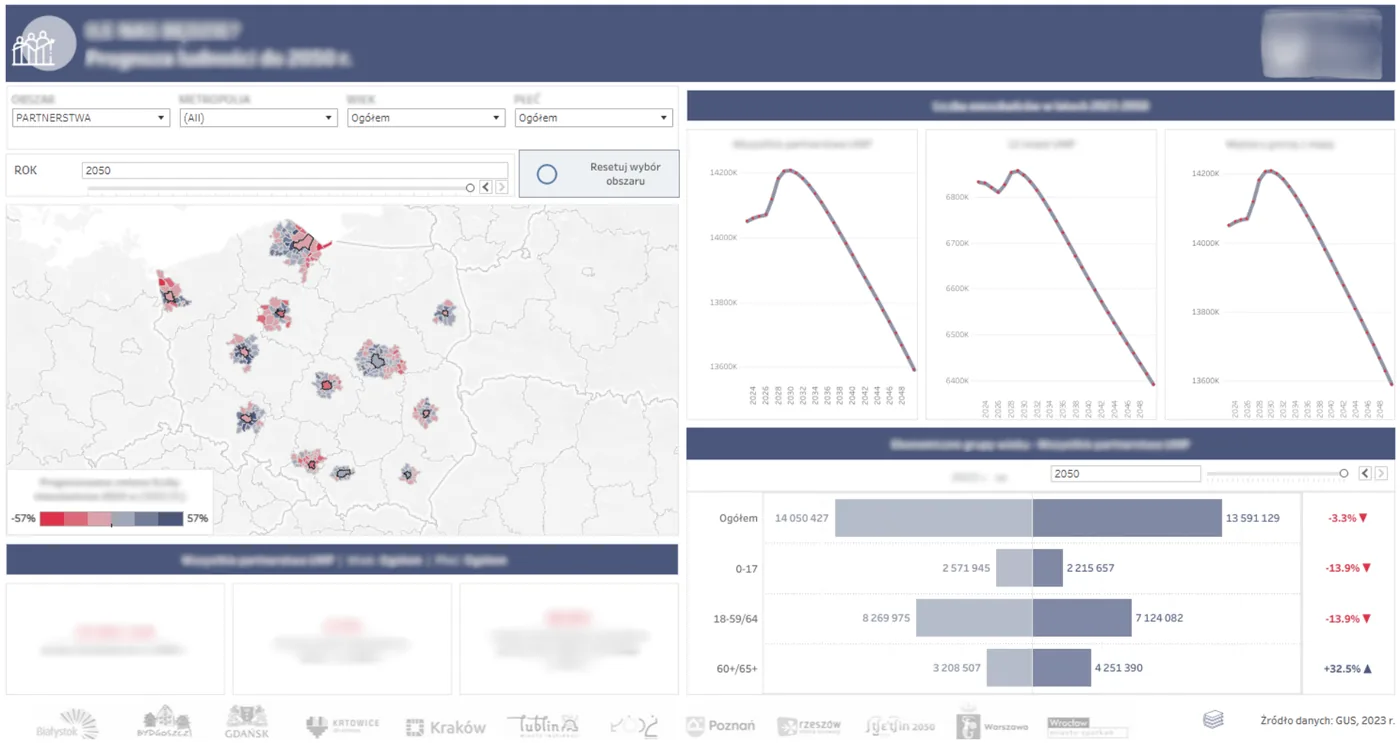
Power BI and Tableau are selected most often for their flexibility, scalability, and strong value for the cost. However, we do not impose a technology—we select the one that best fits the client’s objectives and capabilities.
Case studies: effective sales and distribution reporting
Price promotion report for a supplier to a discount retail chain
Challenge: data was scattered across Excel files, there was no consistent promotion ROI, and analysts manually combined point-of-sale data and budgets.
Solution: implementation of Retail Promo Kit—a Power Query data model and 15 KPI dashboards in Power BI. We also added alerts for promotions below the profitability threshold (“promo below baseline”).
Outcome: within eight days, the promotional budget was shifted to more effective activities, producing a 1.8 percentage-point increase in margin in the following quarter.
Distribution and promotion report for a pharmaceutical and cosmetics distributor
Challenge: there was no central data view—each sales representative analyzed sell-out in a separate spreadsheet, and shelf-stockout information was unavailable.
Solution: we built a Power BI distribution report with analysis by brand, product, and pharmacy, “stock-out” alerts, and a Promo Evaluation Tool to assess promotion effectiveness.
Outcome: shelf stockouts fell by 20%, while sales representatives recovered eight hours per week for client work.
Need a report or dashboard?
Are sales and distribution reports still built in Excel? Change that within days. We will show what a modern dashboard looks like when it genuinely supports decisions: where the company earns money, where it loses it, how promotions perform, and what is happening on the shelf. No delays, chaos, or guesswork.
Let’s discuss the data. Schedule a free consultation—we will assess the situation and show how to take the reporting process to the next level. Contact us and see data analysis without limits.
Which systems do you integrate?
ERP systems, including SAP, Dynamics, Comarch ERP XL, and others; POS, e-commerce, CRM, and CSV and Excel files—all feeding one KPI model.
How long does the first implementation take?
The standard timeline is two to three weeks from workshops to a production dashboard.
Can data still be exported to Excel?
Yes. Power BI provides Analyze in Excel, Microsoft Fabric supports full table export, and Tableau also exports data to Excel and CSV.
How often does the data refresh?
The default is hourly; critical promotion data can refresh every 15 minutes.
Does the report cover promotional budget plan versus actuals?
Yes. The Promo ROI module compares planned volume and costs with realized profit.