Why build a P&L report in Power BI?
Moving from a traditional Excel profit-and-loss (P&L) report to Power BI is a forward-looking step that provides a range of benefits.
If the priority is to organize reporting requirements before selecting a tool, see how Business Intelligence supports profit-and-loss reporting.
- Power BI automates processes, reducing the time required to prepare reports.
- It also provides more advanced visualization options, making complex financial data easier to understand and present.
- Better integration with diverse data sources makes information from different systems easier and more efficient to combine.
- The tool provides stronger data security options, which are critical when working with sensitive financial information.
In short, moving P&L reporting to Power BI creates a more efficient, accurate, and secure financial analysis process.
A Power BI profit-and-loss report is a strong fit when:
- Data from different sources and systems—ERP, accounting systems, SAP, Comarch ERP Optima, and others—needs to be connected quickly and efficiently.
- The team needs flexibility to analyze data across monthly, quarterly, or annual reporting periods.
- Current and historical P&L reports need to be compared.
- All P&L components, including revenue, cost of goods sold, operating expenses, and taxes, need to be available in one place.
- The team needs to monitor operating profit (EBIT) to manage the risk of being unable to meet obligations.
- Trends need to be measured to identify potentially problematic areas.
- Advanced data visualization options are needed to present financial results more clearly.
- Report creation needs to be automated to save time and resources.
- The organization needs a tool that scales and adapts as its requirements grow.
- Data security is a priority and the organization needs Power BI’s stronger access-control and security options.
Comprehensive implementation package
Move to Power BI P&L reporting quickly and effectively with Astrafox. We guide the transition from P&L reports built in Excel to the advanced capabilities of Power BI. We understand the challenges involved in system migrations and provide comprehensive support to minimize the burden on the company and its team. Our specialists work step by step with the client's team to adapt Power BI to the company's specific business requirements, ensure a smooth transition, and maximize the effectiveness of its P&L reporting. Astrafox provides an experienced team and a structured path to the new system.
Needs analysis
At this stage, we focus on understanding the company's specific business requirements and expectations. The goal is to develop a migration plan tailored to those needs.
Technical support
We connect diverse data sources in one Power BI report. Using tools such as Power Query, Astrafox streamlines data management and editing.
Workshops
We deliver comprehensive workshops that teach employees how to use Power BI to build P&L reports. The workshops cover preparing data sources, editing data, and creating dashboards, among other topics.
STAGE 1: Needs analysis
The first and essential step in our work is an analysis of the company’s needs. This stage allows us to understand the organization’s unique business requirements and expectations for P&L reporting. We focus on identifying key objectives, functional requirements, and specific challenges. Based on this information, we develop a migration plan tailored to the organization. This approach produces a solution aligned with the company’s expectations and business context.
STAGE 2: Technical support—connecting sources for a P&L report
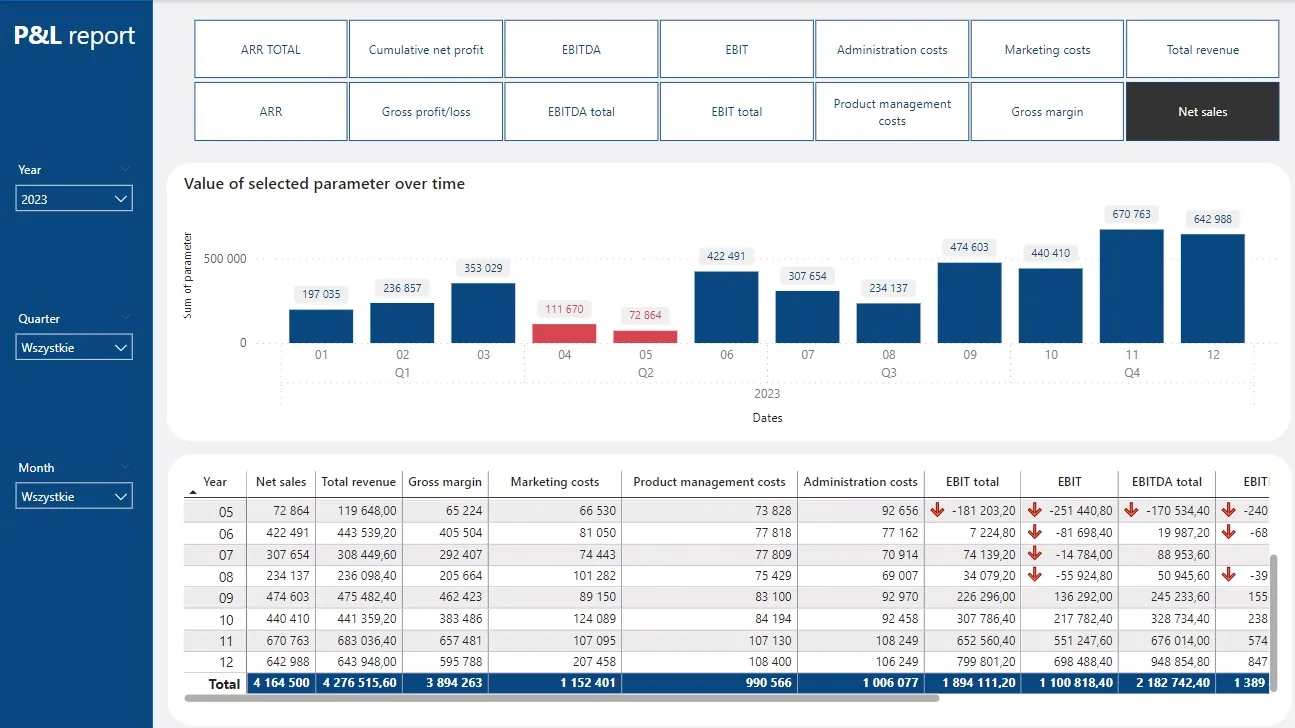
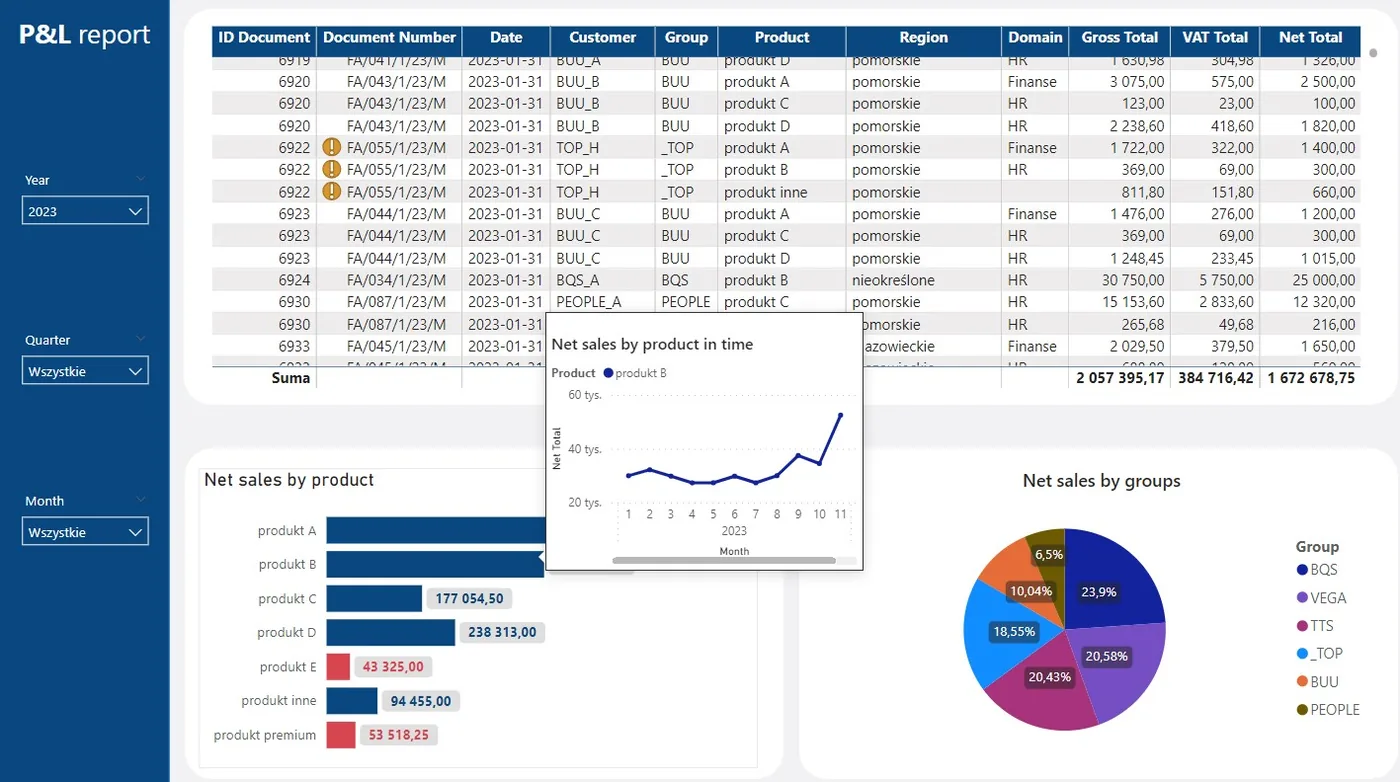
Microsoft Power BI connects data from many different sources. When individual P&L components are stored in separate Excel files or other sources, such as databases or websites, they can be combined in one Power BI report. A shared dashboard built from these sources contains all the most important data. Users no longer need to switch among separate tabs to compare figures and obtain key information. We also use Power Query, which is part of Power BI, to connect and edit data according to the report’s requirements.
Outcome: straightforward data management and access to multiple sources in one place, making key information quick and easy to obtain.
STAGE 3: Workshops
A profit-and-loss (P&L) report is a core part of financial analysis in every company. Knowing how to build this type of report is essential to effective management, strategic planning, and informed business decisions. We therefore offer a multi-day workshop that gives the client’s team the knowledge and skills required to prepare and analyze a P&L report effectively. The workshop covers the following steps:
- Preparing sources for the P&L report.
- Connecting data from different sources to Power BI.
- Editing and combining individual sources with Power Query.
- Creating simple data aggregations with DAX, including SUM and AVERAGE.
- Selecting the right visualizations.
- Building a custom P&L dashboard.
Price and delivery time
The delivery time and price of the “P&L Report in Power BI” package are adapted to the specific needs and expectations of the client. Every company has unique requirements and objectives, so our approach is always tailored to the organization.
The minimum delivery time is five days. During this period, we provide comprehensive subject-matter support covering all key aspects of preparing, analyzing, and visualizing the profit-and-loss report. The final price depends on the company’s requirements and scope of work. Every part of the package is planned to meet those expectations and deliver a high-quality service with tangible value for the organization.