A financial report that speaks the CFO’s language
We build financial reports and management dashboards for CFOs, controllers, and FP&A teams responsible every day for operating margin, cash flow, and budget performance. When the month-end close takes too long, data is scattered across different versions of Excel, and decisions rely on week-old figures, it is time for a change. We deliver a single source of truth—automated, clear dashboards that always show the company’s current financial position.
Types of financial reports we build
Financial report
Presents the company's key financial metrics: revenue, costs, margin, cash flow, and month-over-month and budget comparisons. It supports sound decisions and rapid responses to variances.
Benefits:
- Current view of financial performance
- Early detection of financial problems
- Better investment decisions
Controlling dashboard
A real-time report on costs, revenue, and profitability by department, process, and project.
Benefits:
- Support for controlling and management
- Better planning and budget oversight
- Automated financial reporting
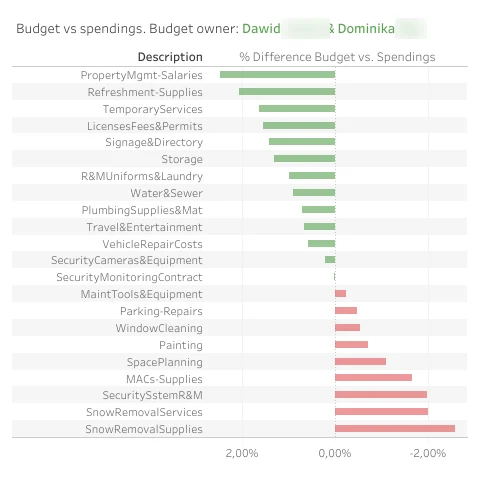
Budget comparison report
Shows the company's actual results against the approved budget, including variances and their causes.
Benefits:
- Rapid response to overruns
- Greater budget discipline
- Reliable performance reporting
Operating expense report
Presents the structure of the company's operating expenses and how they change, with analysis by category and department.
Benefits:
- Identification of inefficient spending
- Optimization of the cost structure
- Higher operating profitability
Income statement and variance analysis
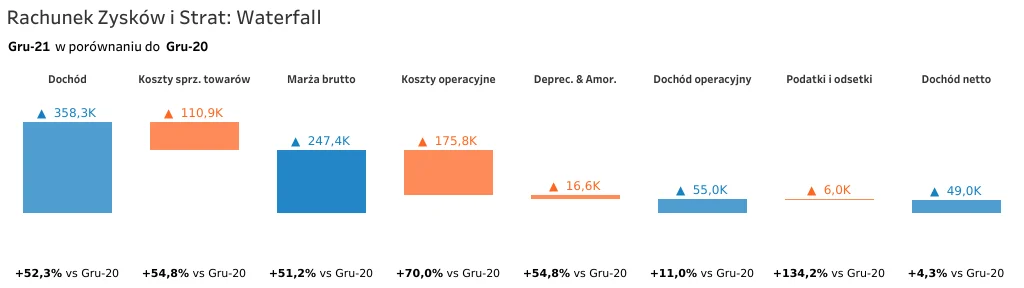
A waterfall chart shows how individual revenue and cost categories affect the result. It makes variances easy to identify and lets users move from an aggregate value to detailed profit-and-loss statement items.
What sets our approach to financial reporting apart?
- Years of financial reporting experience—we specialize in building financial dashboards for CFOs, controllers, and FP&A teams. We have delivered such projects across many industries, in both financial and operational reporting.
- General ledger, budget, and forecast in one place—we connect data from ERP systems (SAP, Navision, Oracle, Comarch ERP XL), forecast spreadsheets, and data warehouses in a standardized P&L, cash flow, and balance sheet model.
- A month-end close shortened by up to 70%—ready-made data flows and dashboards eliminate manual consolidation, while built-in health checks identify posting inconsistencies.
- What-if scenarios—a CFO sees the effect of exchange rates or rising energy costs on EBITDA within seconds.
- Client trust confirmed by their feedback—dozens of companies across industries, from finance and manufacturing to retail and logistics, have trusted us. Highly rated implementations, rapid responses to business needs, and collaborative communication bring many clients back for further projects.
- Custom solutions—we build every dashboard from the ground up, tailoring its format and presentation to user roles and financial processes. We work transparently, following leading UX/UI and visualization standards.
- A full range of BI services—we deliver comprehensive BI implementations, from data preparation through reporting and migrations to outsourcing and long-term support.
- Clear, collaborative communication—we provide regular consultations, visibility into progress, and an honest fit between the solution, the company’s needs, and its budget.
Which technologies do we use to build financial reports?
We use proven Business Intelligence tools that combine ease of use with strong performance and data security. We always select technology for the client’s current environment, including IT infrastructure, organizational structure, and budget.
- Power BI—Microsoft’s comprehensive BI platform
The platform is valued for fast connections to diverse data sources, automated refreshes, full integration with Microsoft services such as Azure, Teams, and SharePoint, and extensive DAX-based analytics.
- Tableau—flexible, high-quality data visualization
The platform is known for its intuitive drag-and-drop interface, extensive visualization options, and geospatial data support. It integrates with data warehouses and cloud platforms such as Snowflake and BigQuery, supporting dynamic analysis.
- Amazon QuickSight—cloud analytics on AWS
A lightweight, scalable BI platform fully integrated with the AWS ecosystem. Its per-session pricing model works particularly well for large user populations. It supports machine learning-based forecasting and alerts.
- Looker—centralized data modeling in Google Cloud
A modern tool based on LookML, a modeling language that maintains consistent analytics logic across an organization. It integrates closely with BigQuery and supports self-service BI.
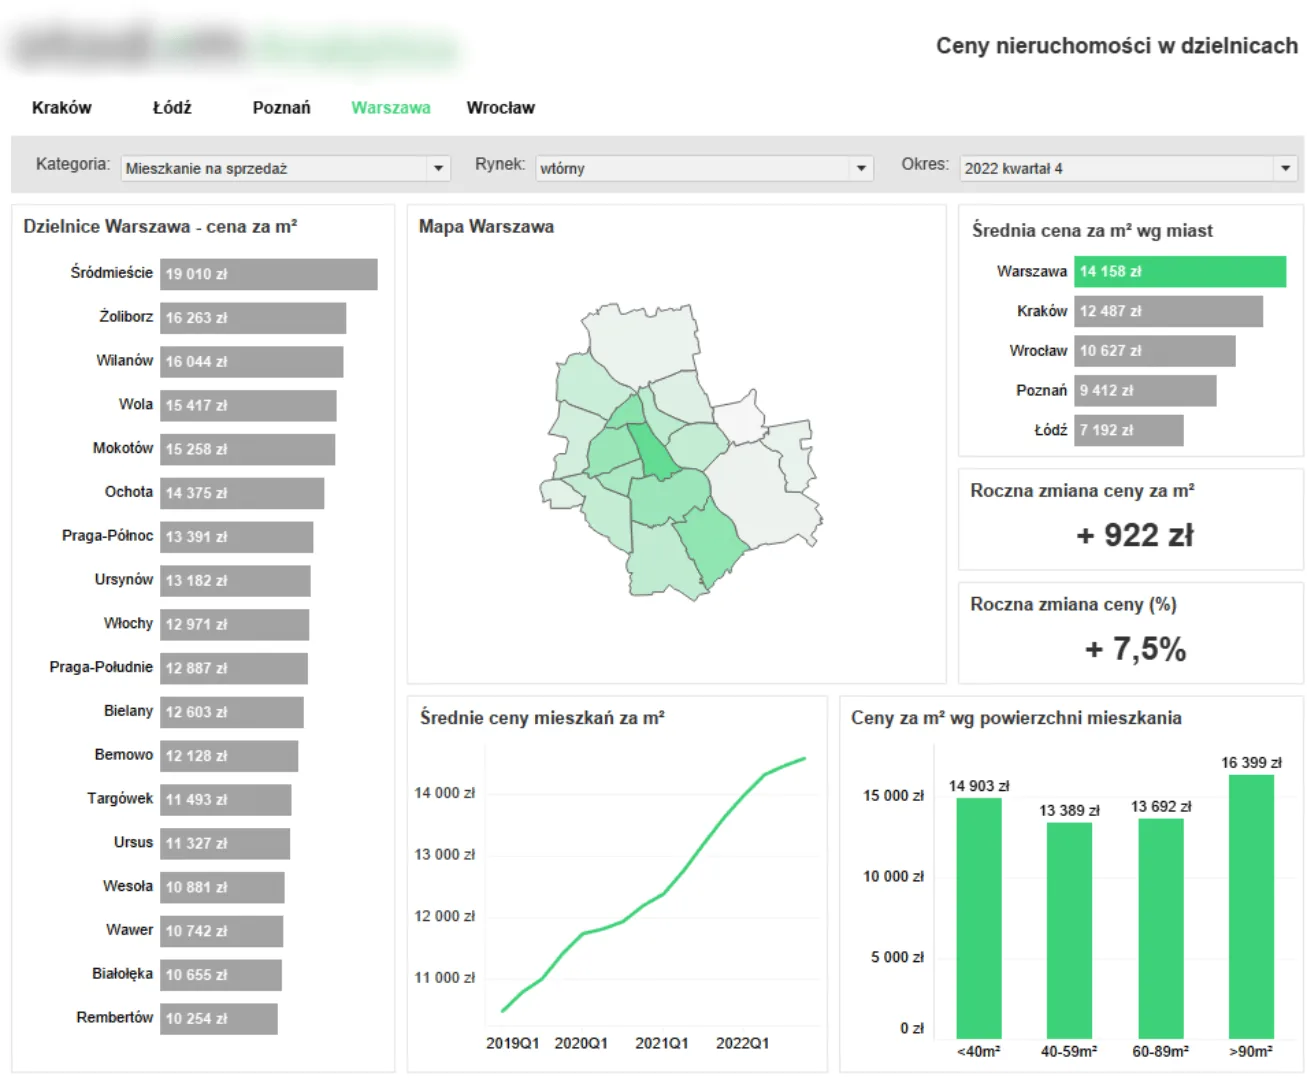
Power BI and Tableau are the tools our clients select most often because of their versatility and strong value for the cost, but we always match the technology to the need. We do not promote one tool—we deliver the solution that best supports specific business objectives.
Case studies: effective financial reporting
P&L consolidation for a manufacturing group with four companies
Challenge: the month-end close took six days, and each company worked with separate P&L spreadsheets, making data consolidation and comparison difficult.
Solution: we implemented a standardized consolidation model in Alteryx and a Tableau financial dashboard with P&L and cash flow views. The data refreshes automatically every 30 minutes.
Outcome: the month-end close was reduced to two days, and the first report reaches management on the morning of the first business day. The data is fully consistent across the group.
Stress tests and what-if analysis for a retail bank
Challenge: the risk team performed analyses across 16 Excel tabs, manually adding exchange rates and interest-rate curves. The process was time-consuming and prone to error.
Solution: we moved the calculations to a Snowflake data warehouse and present the results in Power BI with an interactive what-if panel.
Outcome: worst-case scenario analysis now takes minutes, and a completed report can be sent to the regulator immediately—without manual editing or file consolidation.
Need a report or dashboard?
Manual month-end closes, conflicting versions of Excel files, last-minute pressure, and no single reliable source of data? When these problems sound familiar, it is time for a change. We build financial dashboards that consolidate data from multiple systems and files, automate reporting, and let finance teams focus on analysis instead of tracking down errors. Want to close the month in two days instead of a week? Or do you need one authoritative P&L refreshed every 30 minutes?
Let’s discuss the data. Schedule a free consultation—we will assess the situation and show how to take the reporting process to the next level. Contact us and see data analysis without limits.
Which financial systems do you support?
SAP FI/CO, Microsoft Dynamics, Oracle E-Business Suite, Comarch, Exact, any other system, and Excel or CSV forecast files.
Do the reports support multiple currencies and IFRS?
Yes. The data model includes a currency layer with National Bank of Poland (NBP) and ECB exchange rates and IFRS account mapping.
Can I add custom KPI formulas?
Yes. New measures can be added without code in the Power BI or Tableau semantic layer, with version control preserved.
How long does a full financial dashboard implementation take?
With an agreed template, two to three weeks; fully custom projects usually take six to ten weeks.
Can analysts export data to Excel?
Every view includes an Analyze in Excel function that preserves drill-through and access rights.