Improving sorting quality is critical to eliminating misrouted parcels
The growing e-commerce market is driving demand for fast shipment of large parcel volumes. Expectations for delivery effectiveness are also rising. Failure to deliver a parcel on the first scheduled date can have various causes, including causes on the recipient’s side. However, a courier company needs to ensure that a delivery attempt is made on the first day after shipment.
When this does not happen, inefficient parcel sorting can be one of the causes. Improving quality in this area produces:
- Higher delivery success rates.
- Greater customer satisfaction.
- Lower costs.
Does the company use an implemented Business Intelligence reporting system?
Is a required capability difficult to find? Does the current version appear to be missing something?
REQUEST A FREE CONSULTATION. WE WILL IDENTIFY AREAS FOR IMPROVEMENT AND THE RIGHT SOLUTIONS.
Use analytics tools to keep pace with growing customer requirements
Parcel sorting quality problems affect courier companies more often as daily order volumes approach the limit of their capacity. Increased order volumes overload operational logistics teams and affect delivery quality, which directly reduces customer satisfaction when delivery errors occur.
The scale is illustrated by a conversation with one of our logistics clients during the pandemic. When asked how the increased parcel volumes affected the company, the client explained that operations had reached, throughout the year, an intensity previously seen only during the preholiday peak in December.
At our client, a team of several people was involved in parcel logistics, analyzing shipments and making corrections on an ongoing basis. Because all analyses were performed manually and stored in Excel, the work was time-consuming and carried a high risk of error.
Explore the solution we built for our client’s requirements
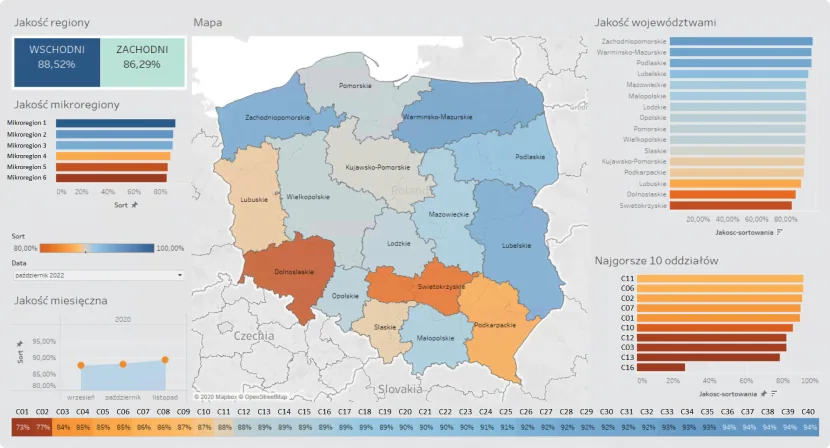
Map of Poland showing the performance quality of regions and microregions
- A map of Poland divided into regions and microregions specific to the client.
- Visualization of sorting quality by region, identifying the 10 lowest-performing branches.
- Comparison of the average delivery success rate for the entire country for a given logistics provider.
- Flexible date filters for selecting the period used to check sorting accuracy.
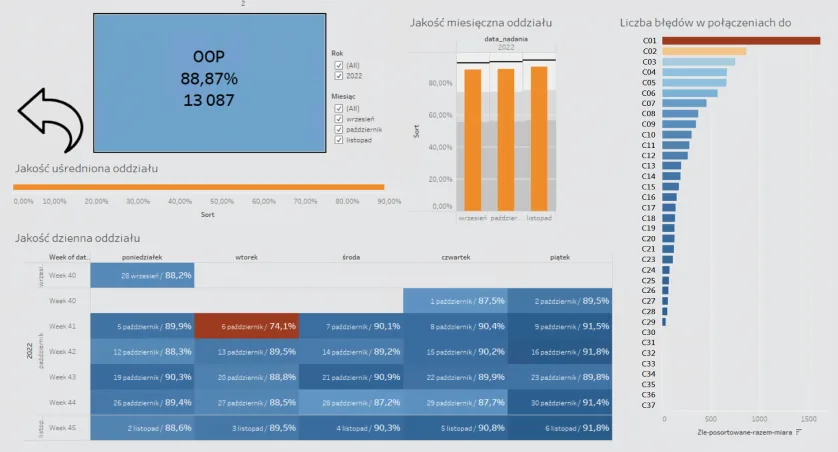
Error relationships between branches
- A map of Poland divided into regions and microregions specific to the client.
- Visualization of sorting quality by region, identifying the 10 lowest-performing branches.
- Comparison of the average delivery success rate for the entire country for a given logistics provider.
Lists of parcels incorrectly sorted by a branch
- A map of Poland divided into regions and microregions specific to the client.
- Visualization of sorting quality by region, identifying the 10 lowest-performing branches.
- Comparison of the average delivery success rate for the entire country for a given logistics provider.
*The client accepted the completed solution as a tool that supported the logistics team’s work and was critical to eliminating incorrect shipments.