Volume, status, and timeliness
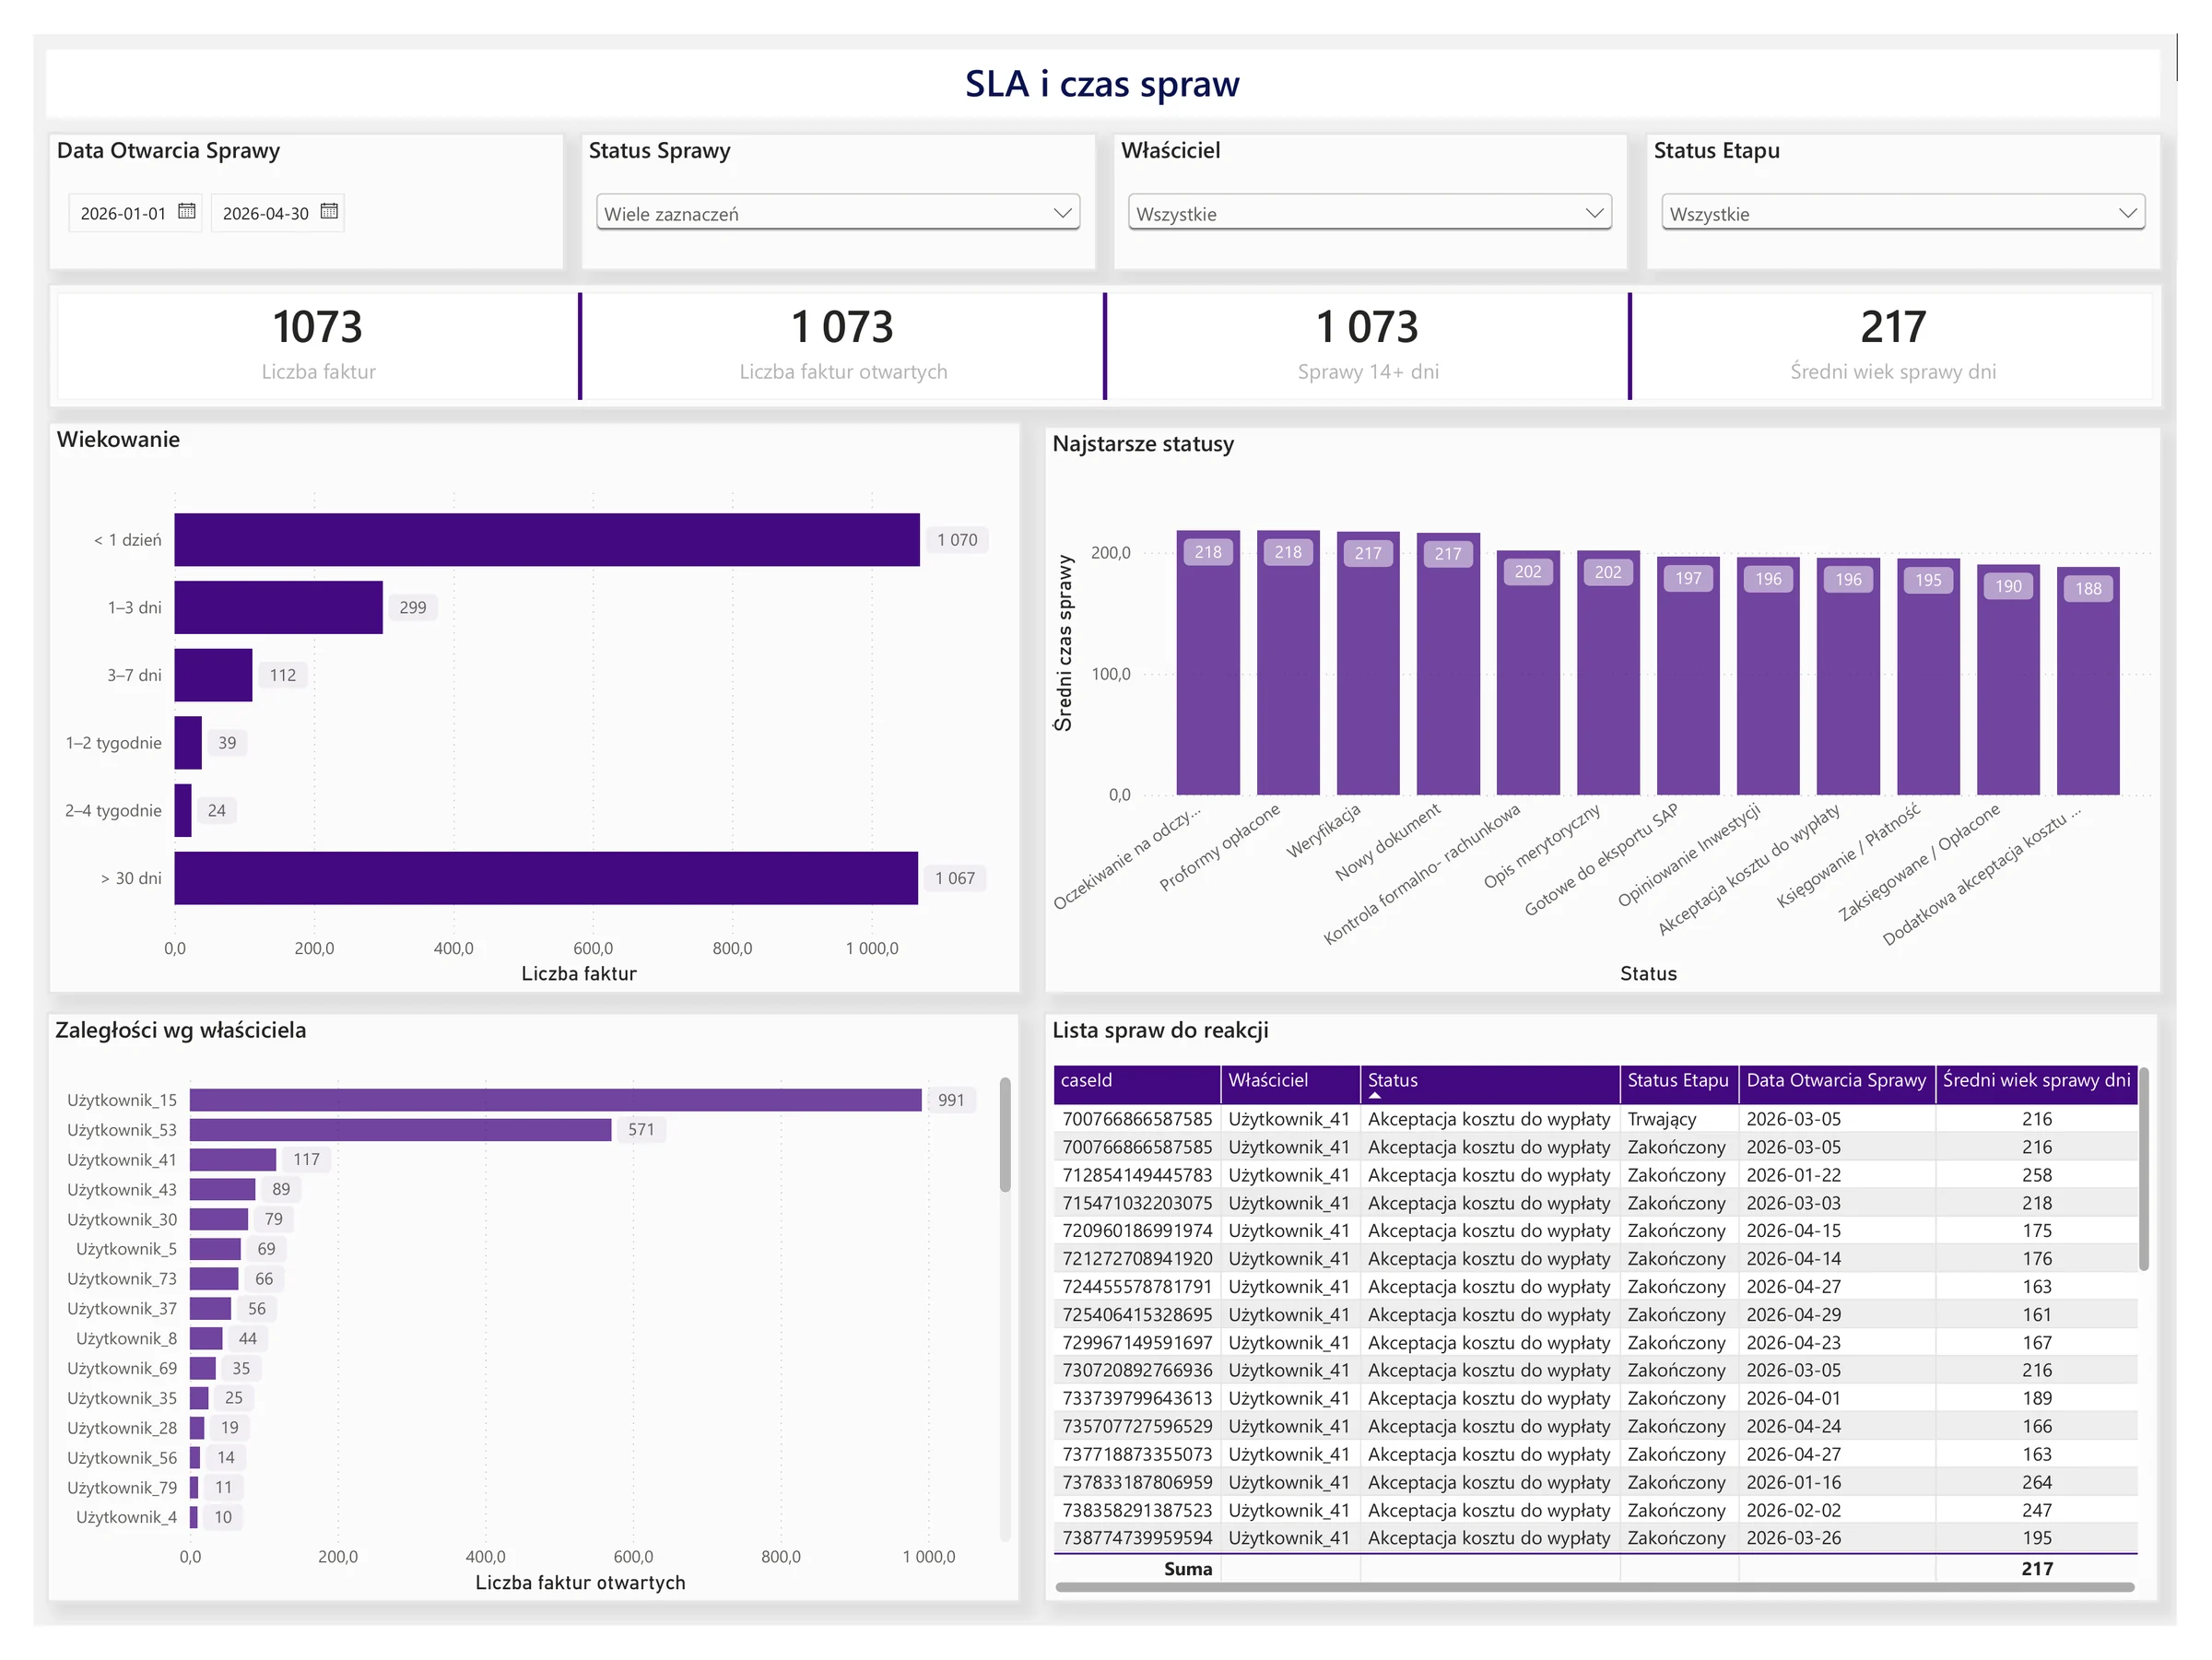
Number of cases or documents, share closed, aging, breaches of the agreed completion time (SLA), backlog, and trends.
The BI report combines data from AMODIT or another BPM and document workflow system. It shows process health, deadlines, stage duration, rework, workload, and bottlenecks. Instead of only signaling a problem, it provides a path to locate it, diagnose it, and decide what action to take.
A process system records every step, but a daily case list does not always show where work slows down or why. The BI layer organizes process history around the questions asked by the person accountable for the outcome.
| Before | After |
|---|---|
| Statuses are visible, but assessing the health of the entire process is difficult. | One view combines volume, timeliness, completion time, rework, and the most important alerts. |
| The average looks acceptable even though some cases have been waiting too long. | Aging and the time distribution reveal the long tail and cases requiring action. |
| Cases are known to return, but no one knows between which stages. | Transition analysis shows where work is repeated and which path should be investigated. |
| A high level of manual work is automatically treated as a problem. | Prioritization considers volume, delays, and complexity together, distinguishing necessary handling from a strong candidate for automation. |
Each view has a role in the analysis. First, it detects a variance. Then it identifies the location and possible cause. Finally, it indicates the area where action should be taken.
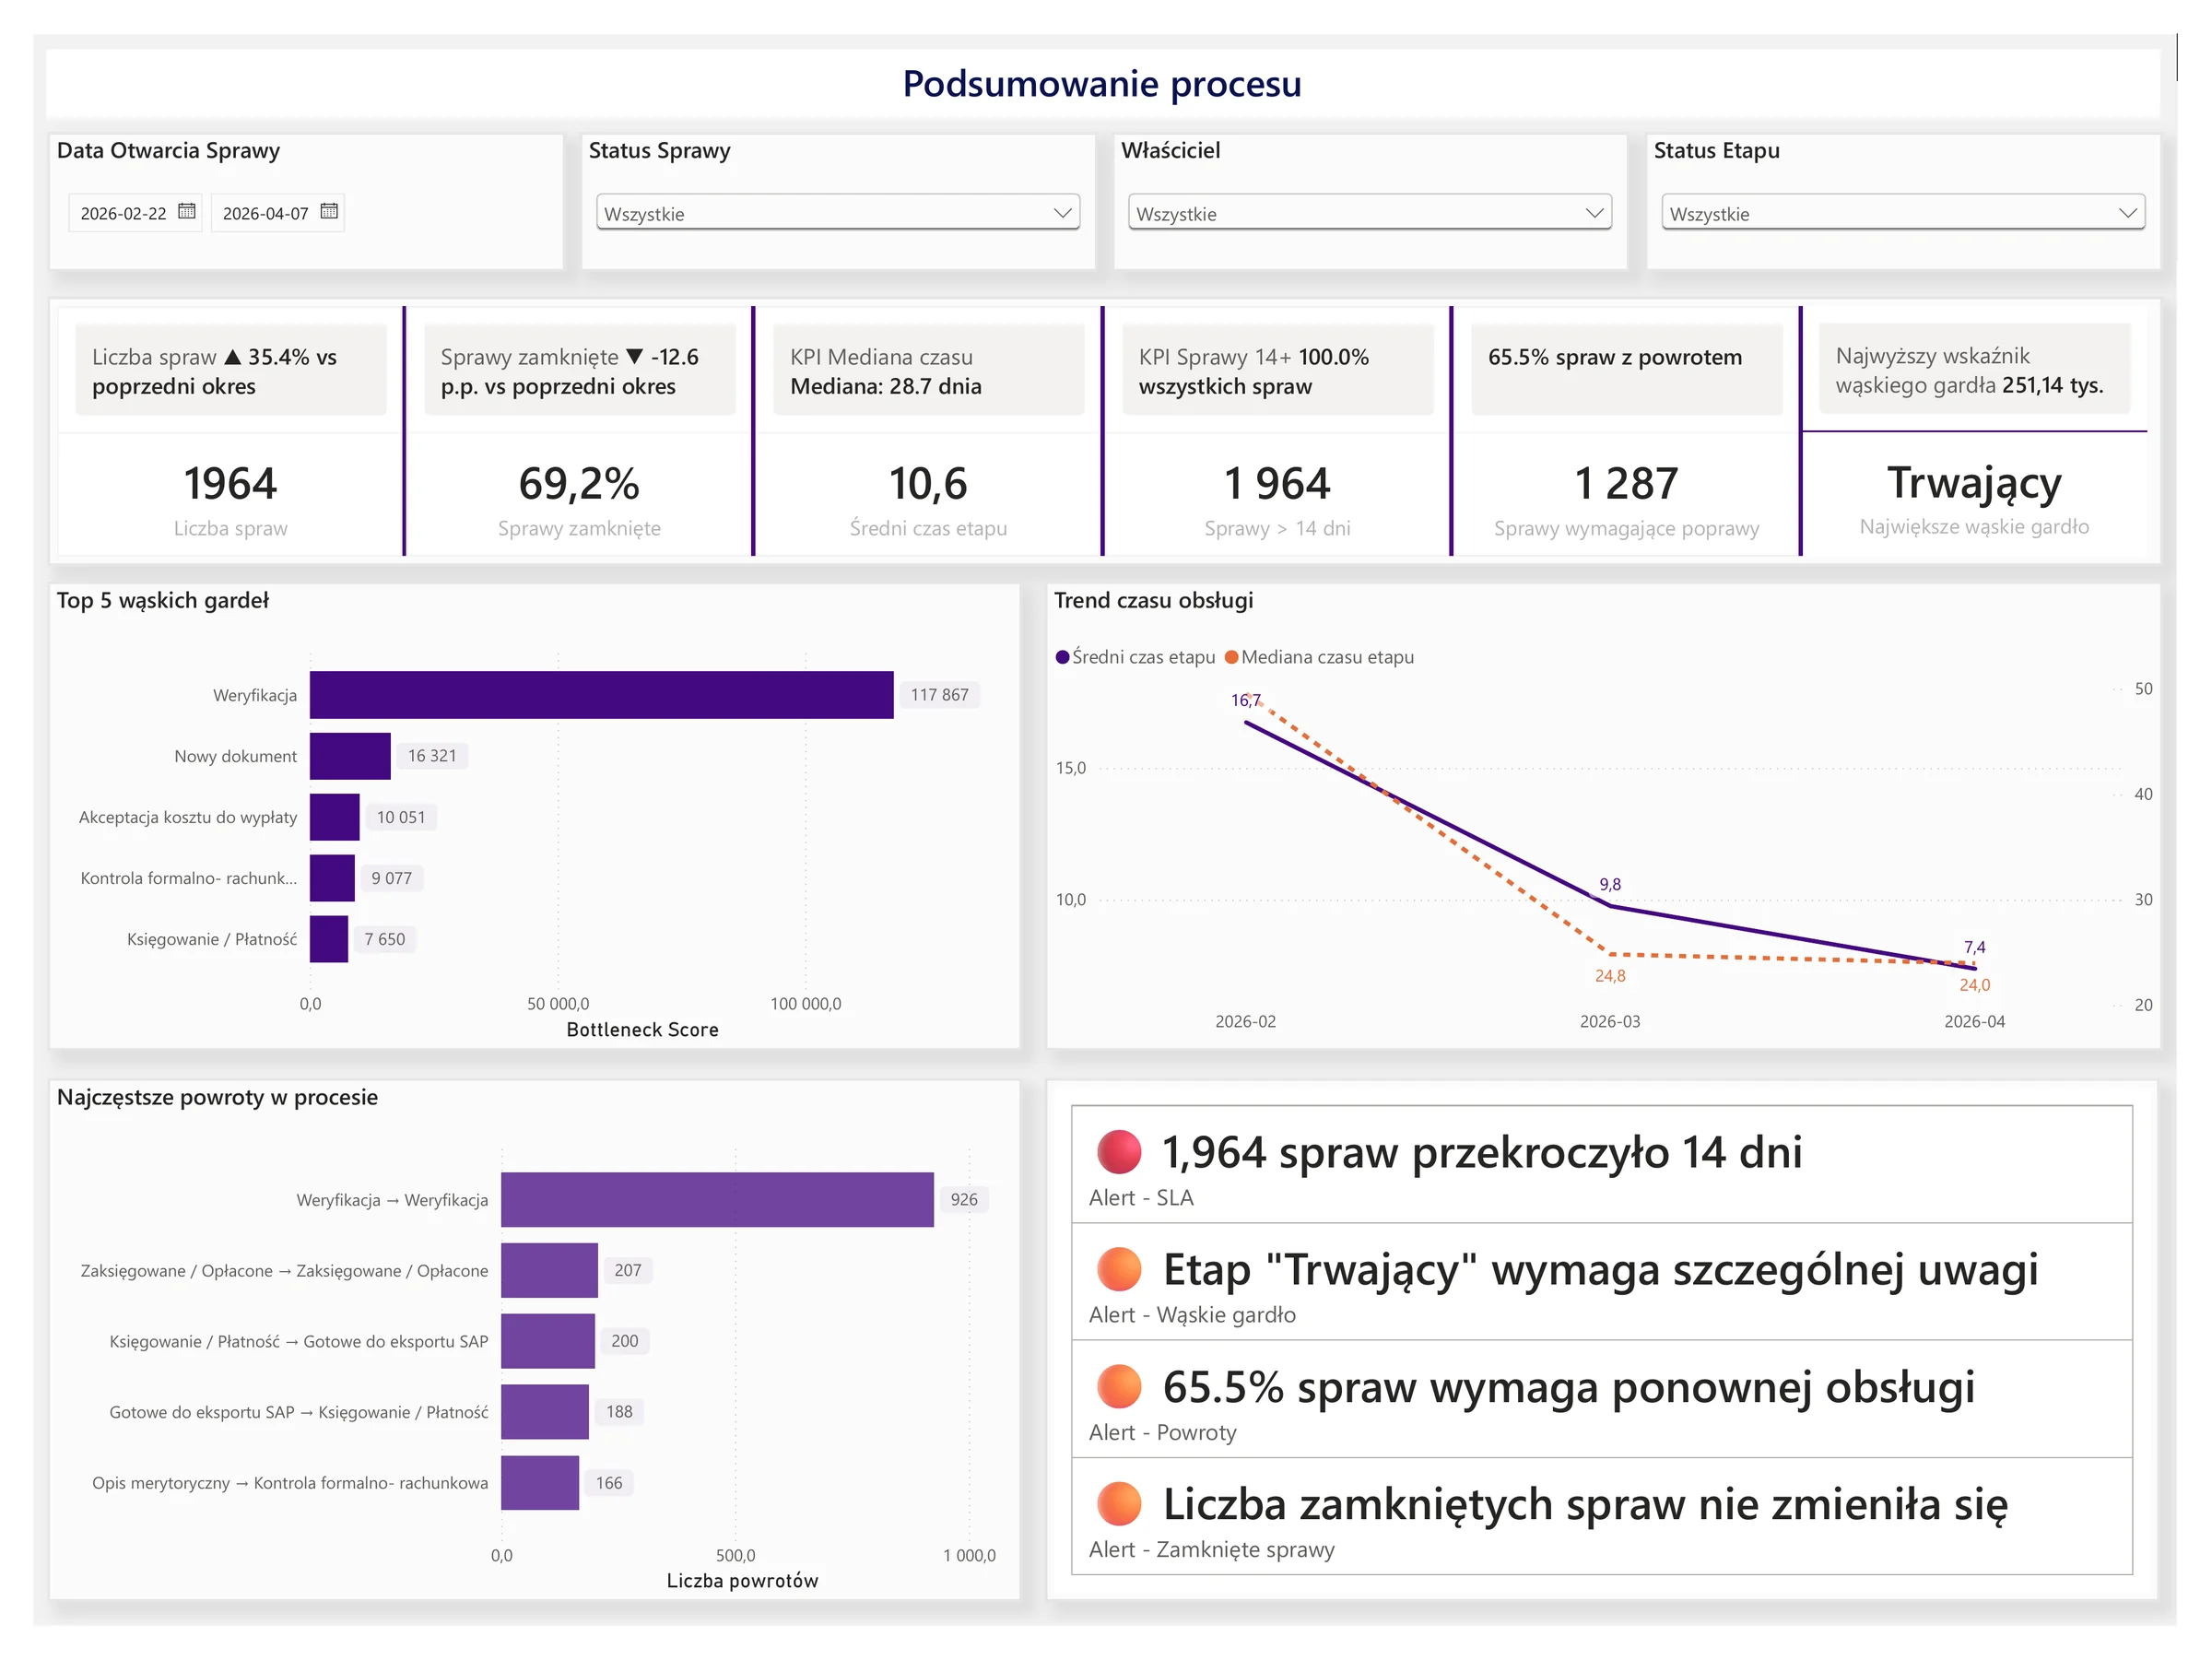
The summary combines case volume, the share of closed cases, completion time, breaches of an agreed threshold, rework, and the largest bottleneck. Changing the period or status recalculates the view within one context.
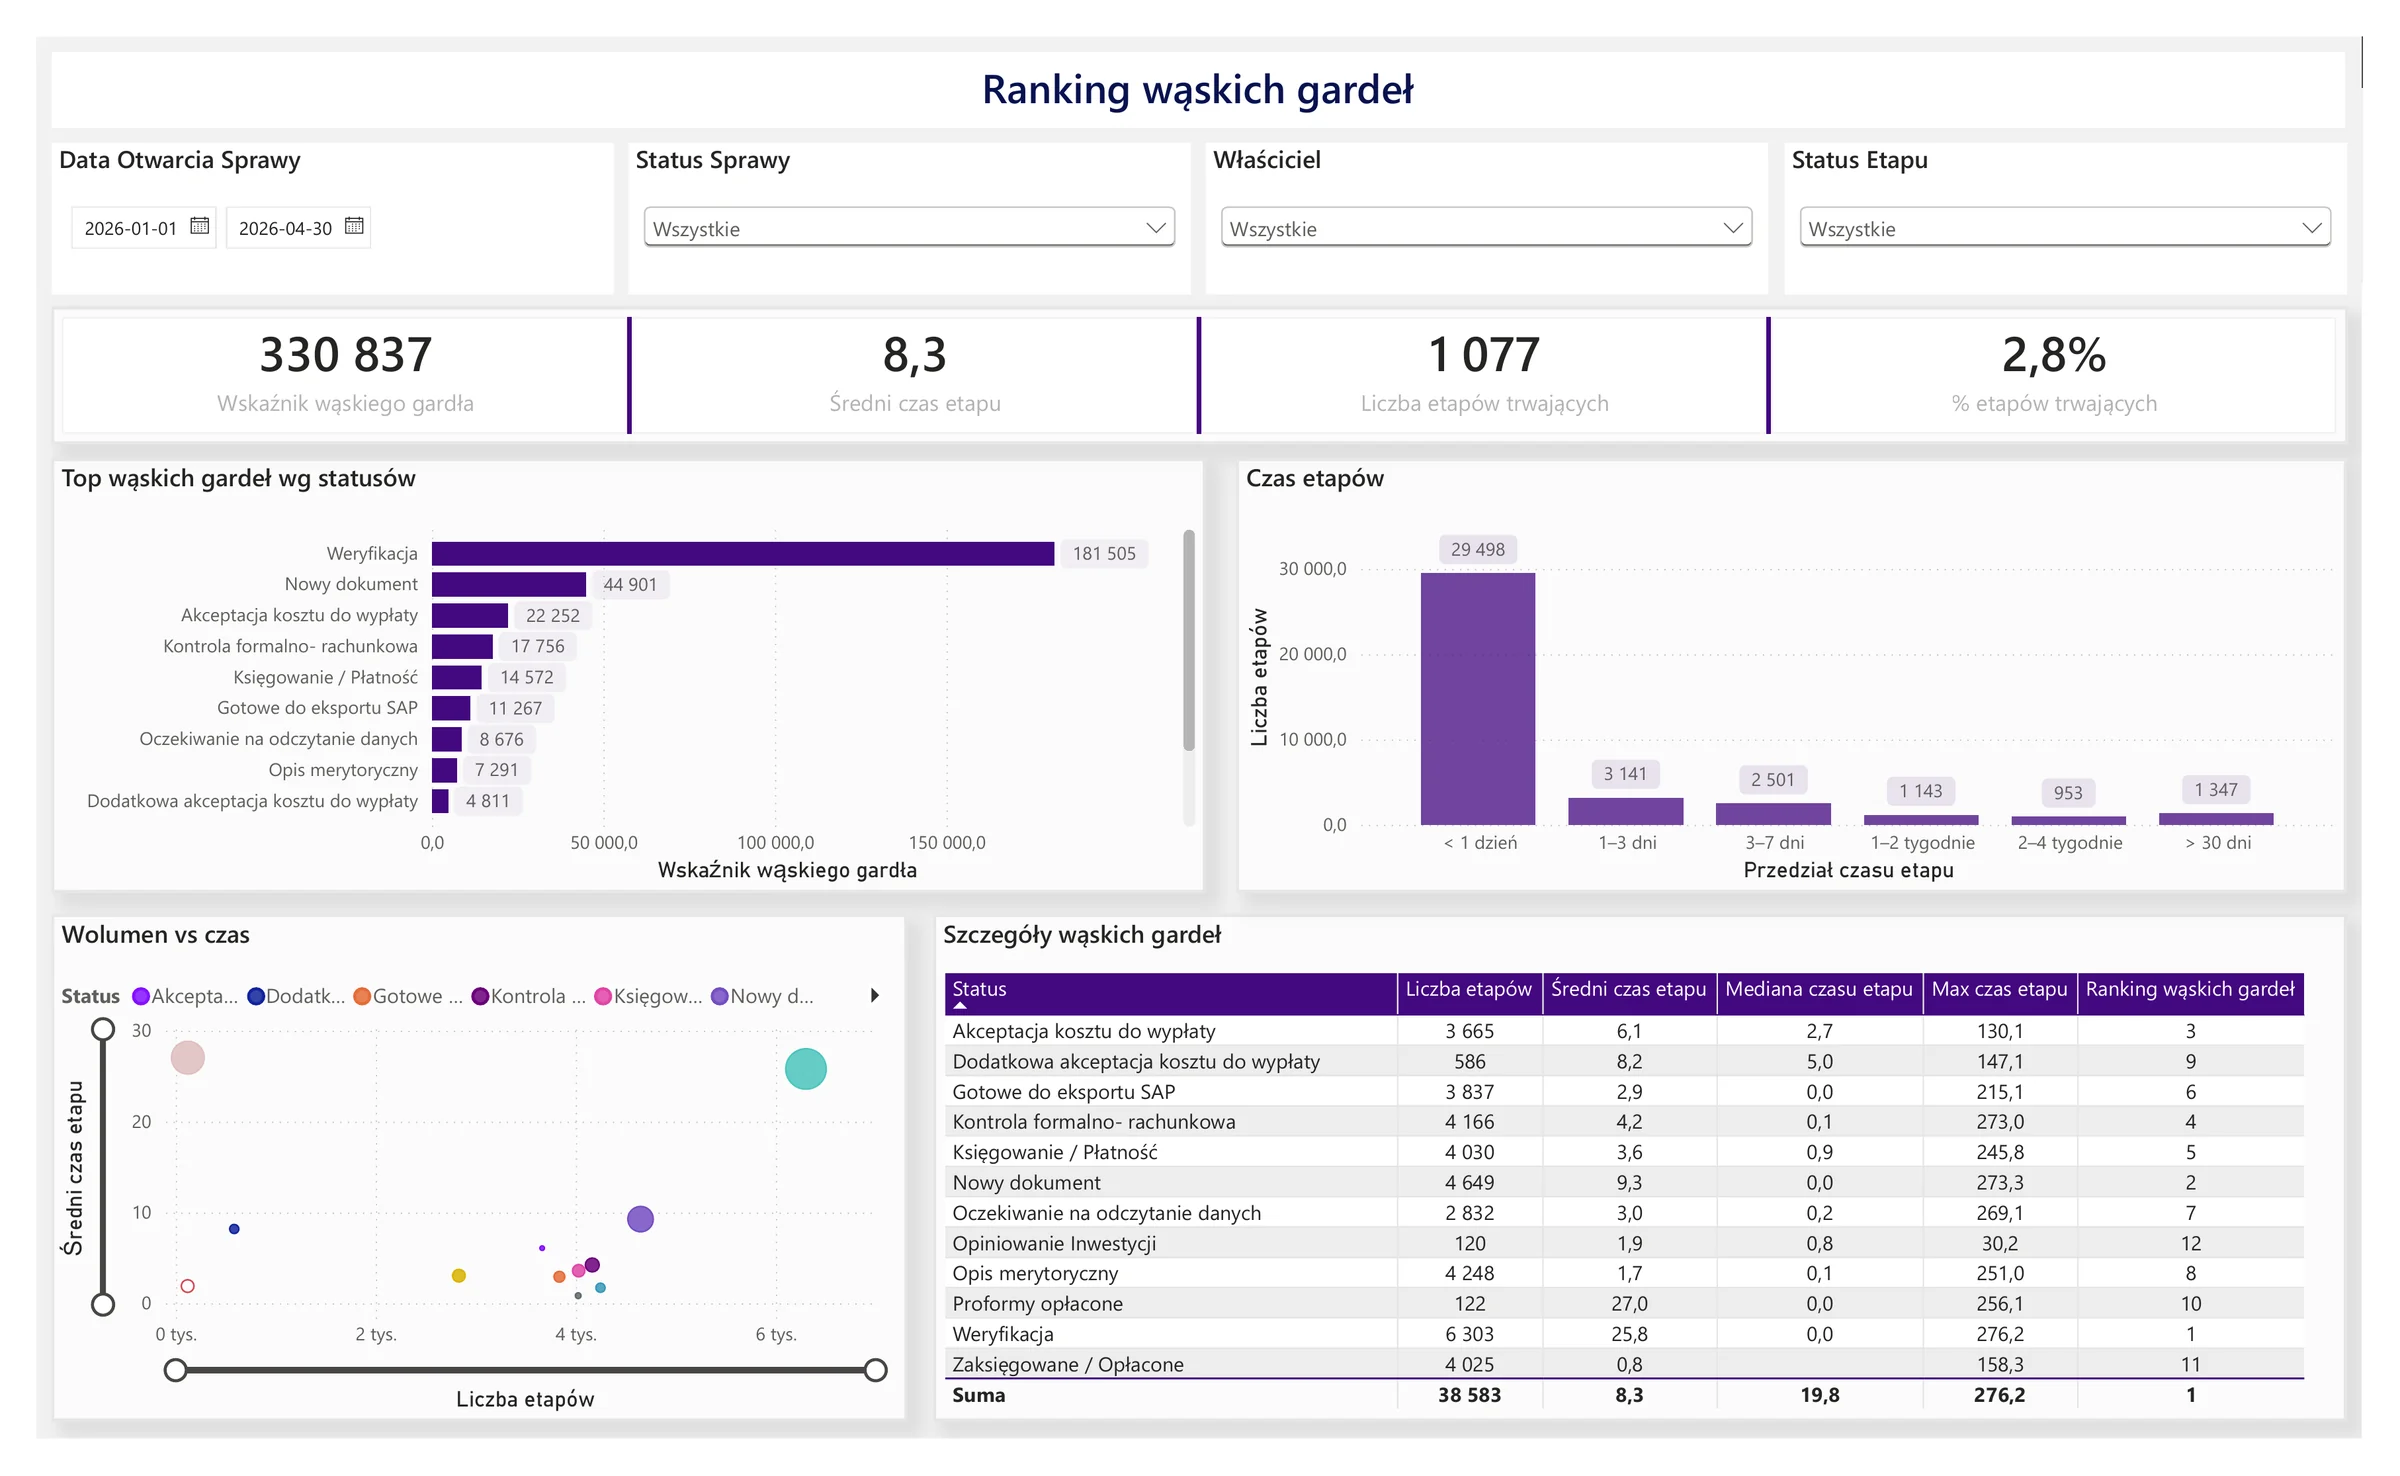
The report breaks the process into stages and compares their duration, median, maximum, number of active stages, and volume. The ranking helps distinguish isolated exceptions from a problem in the design of a stage.
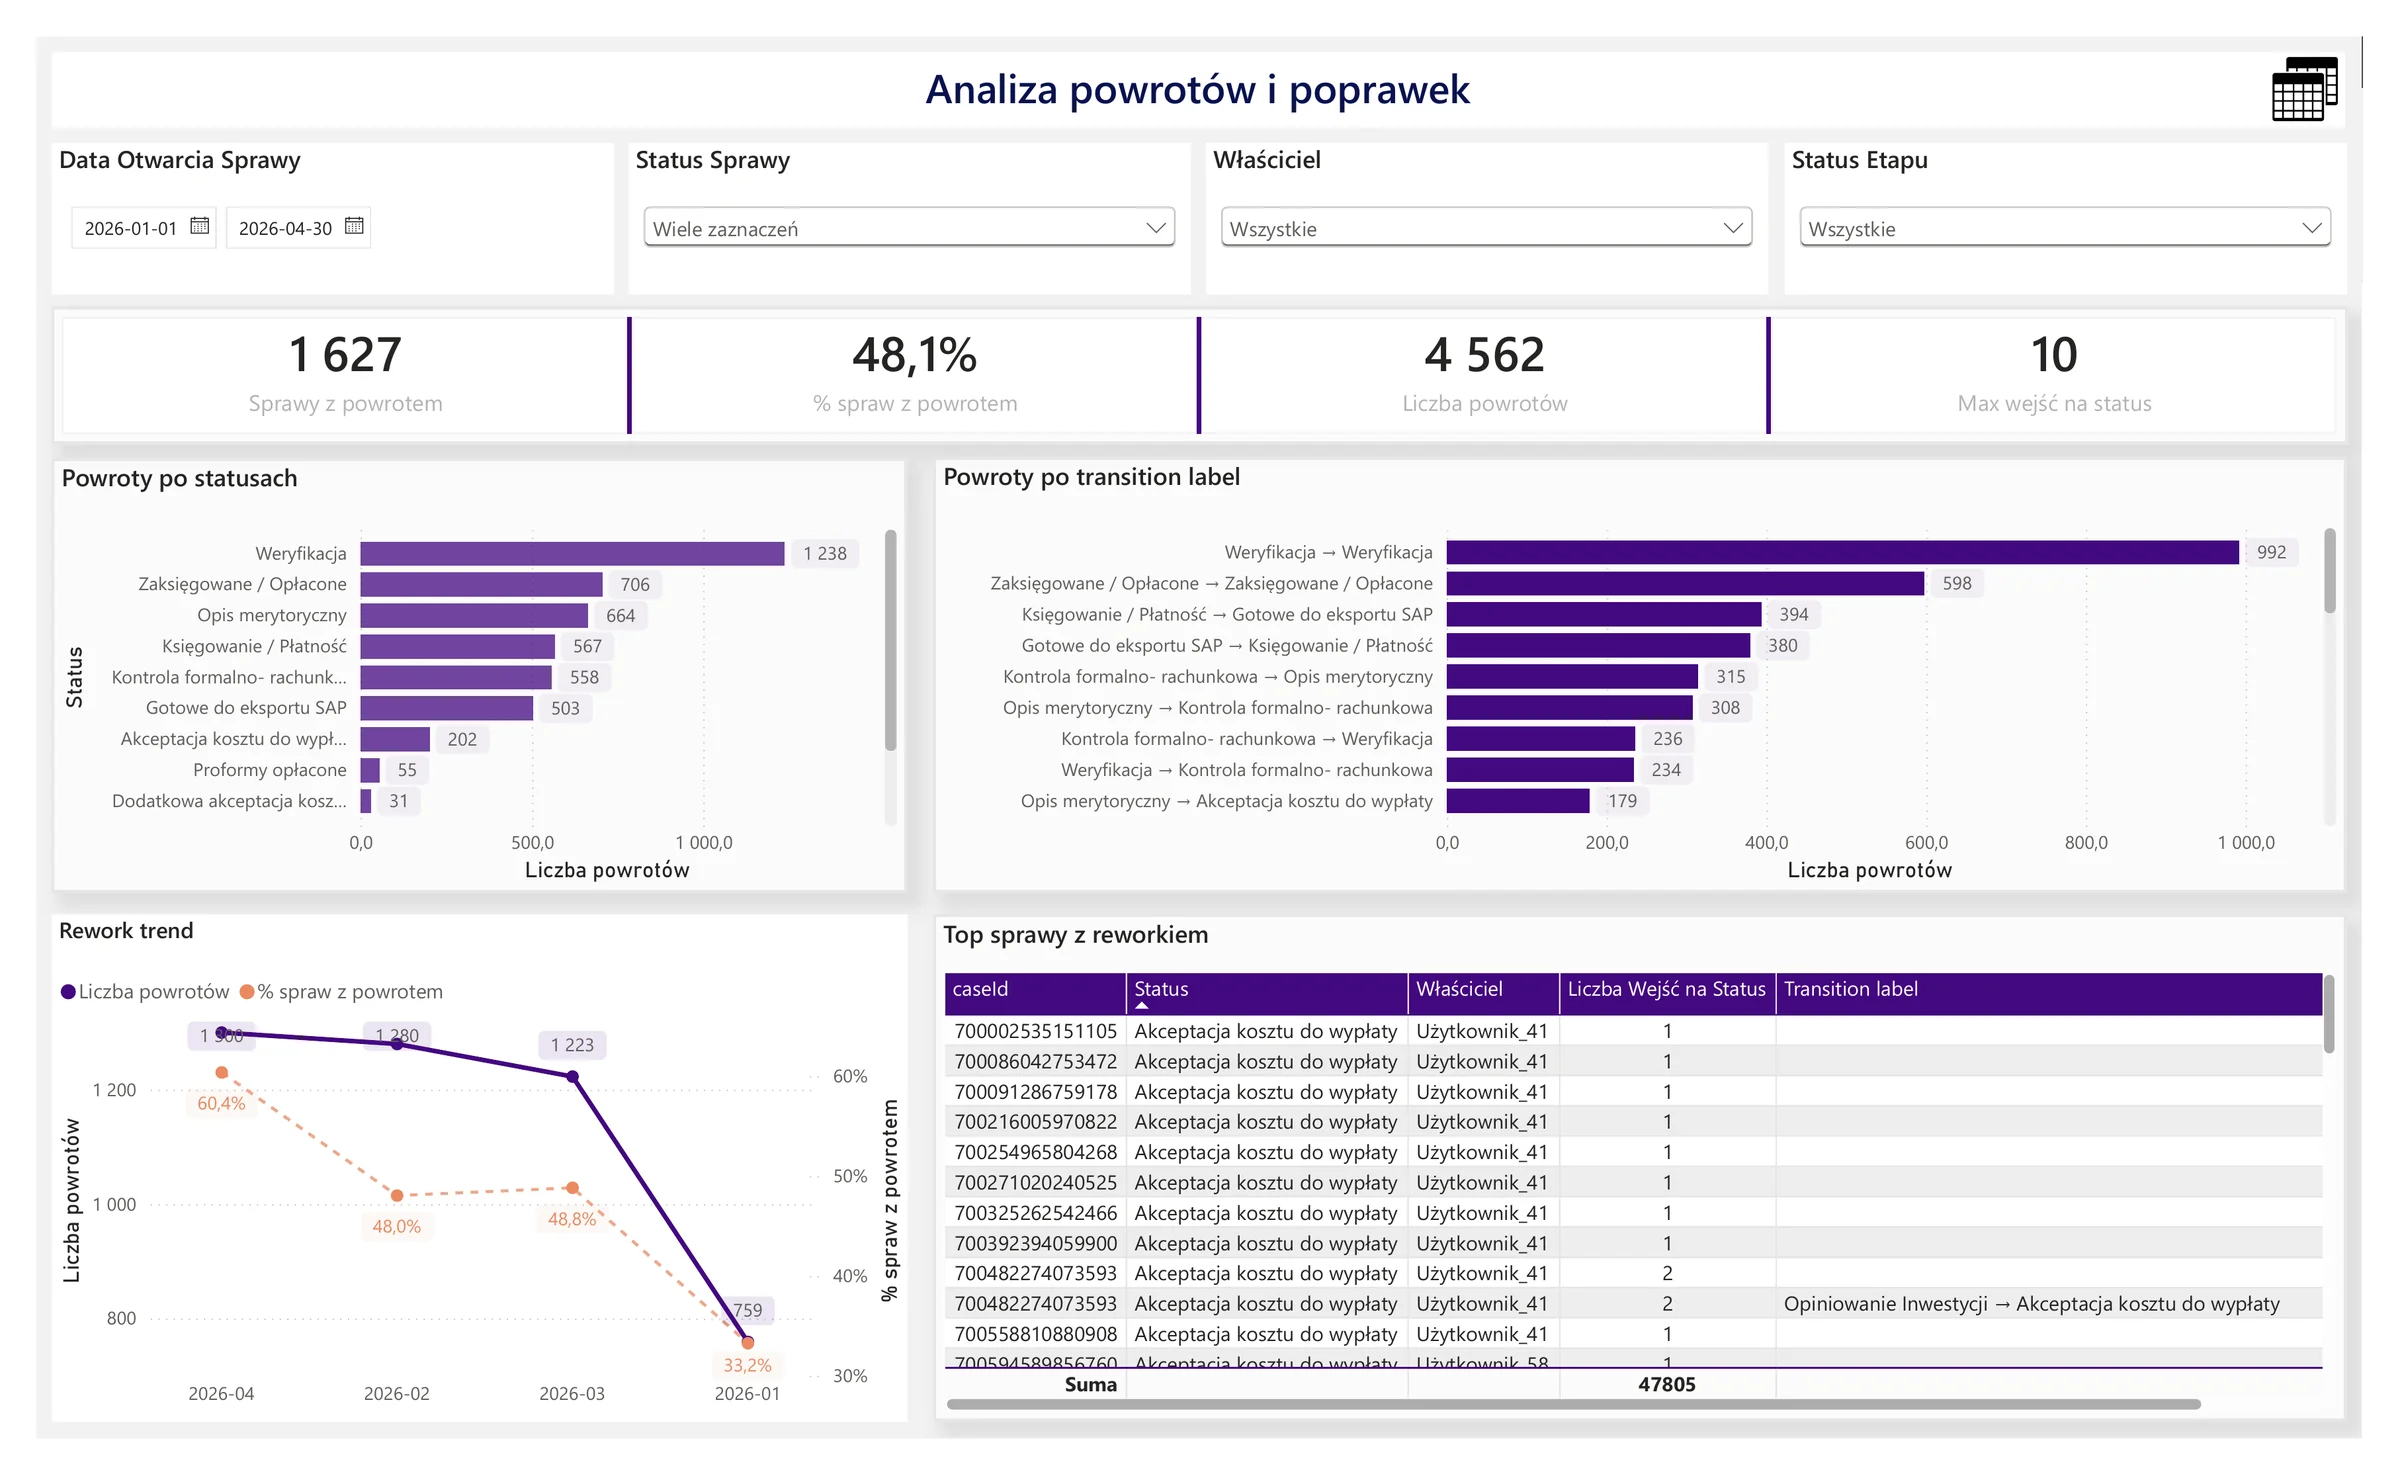
Rework analysis shows the stages between which cases return most often. Workload views show how work is distributed and allow it to be compared with rework and delays. The result supports process and team capacity analysis, not automatic employee evaluation.
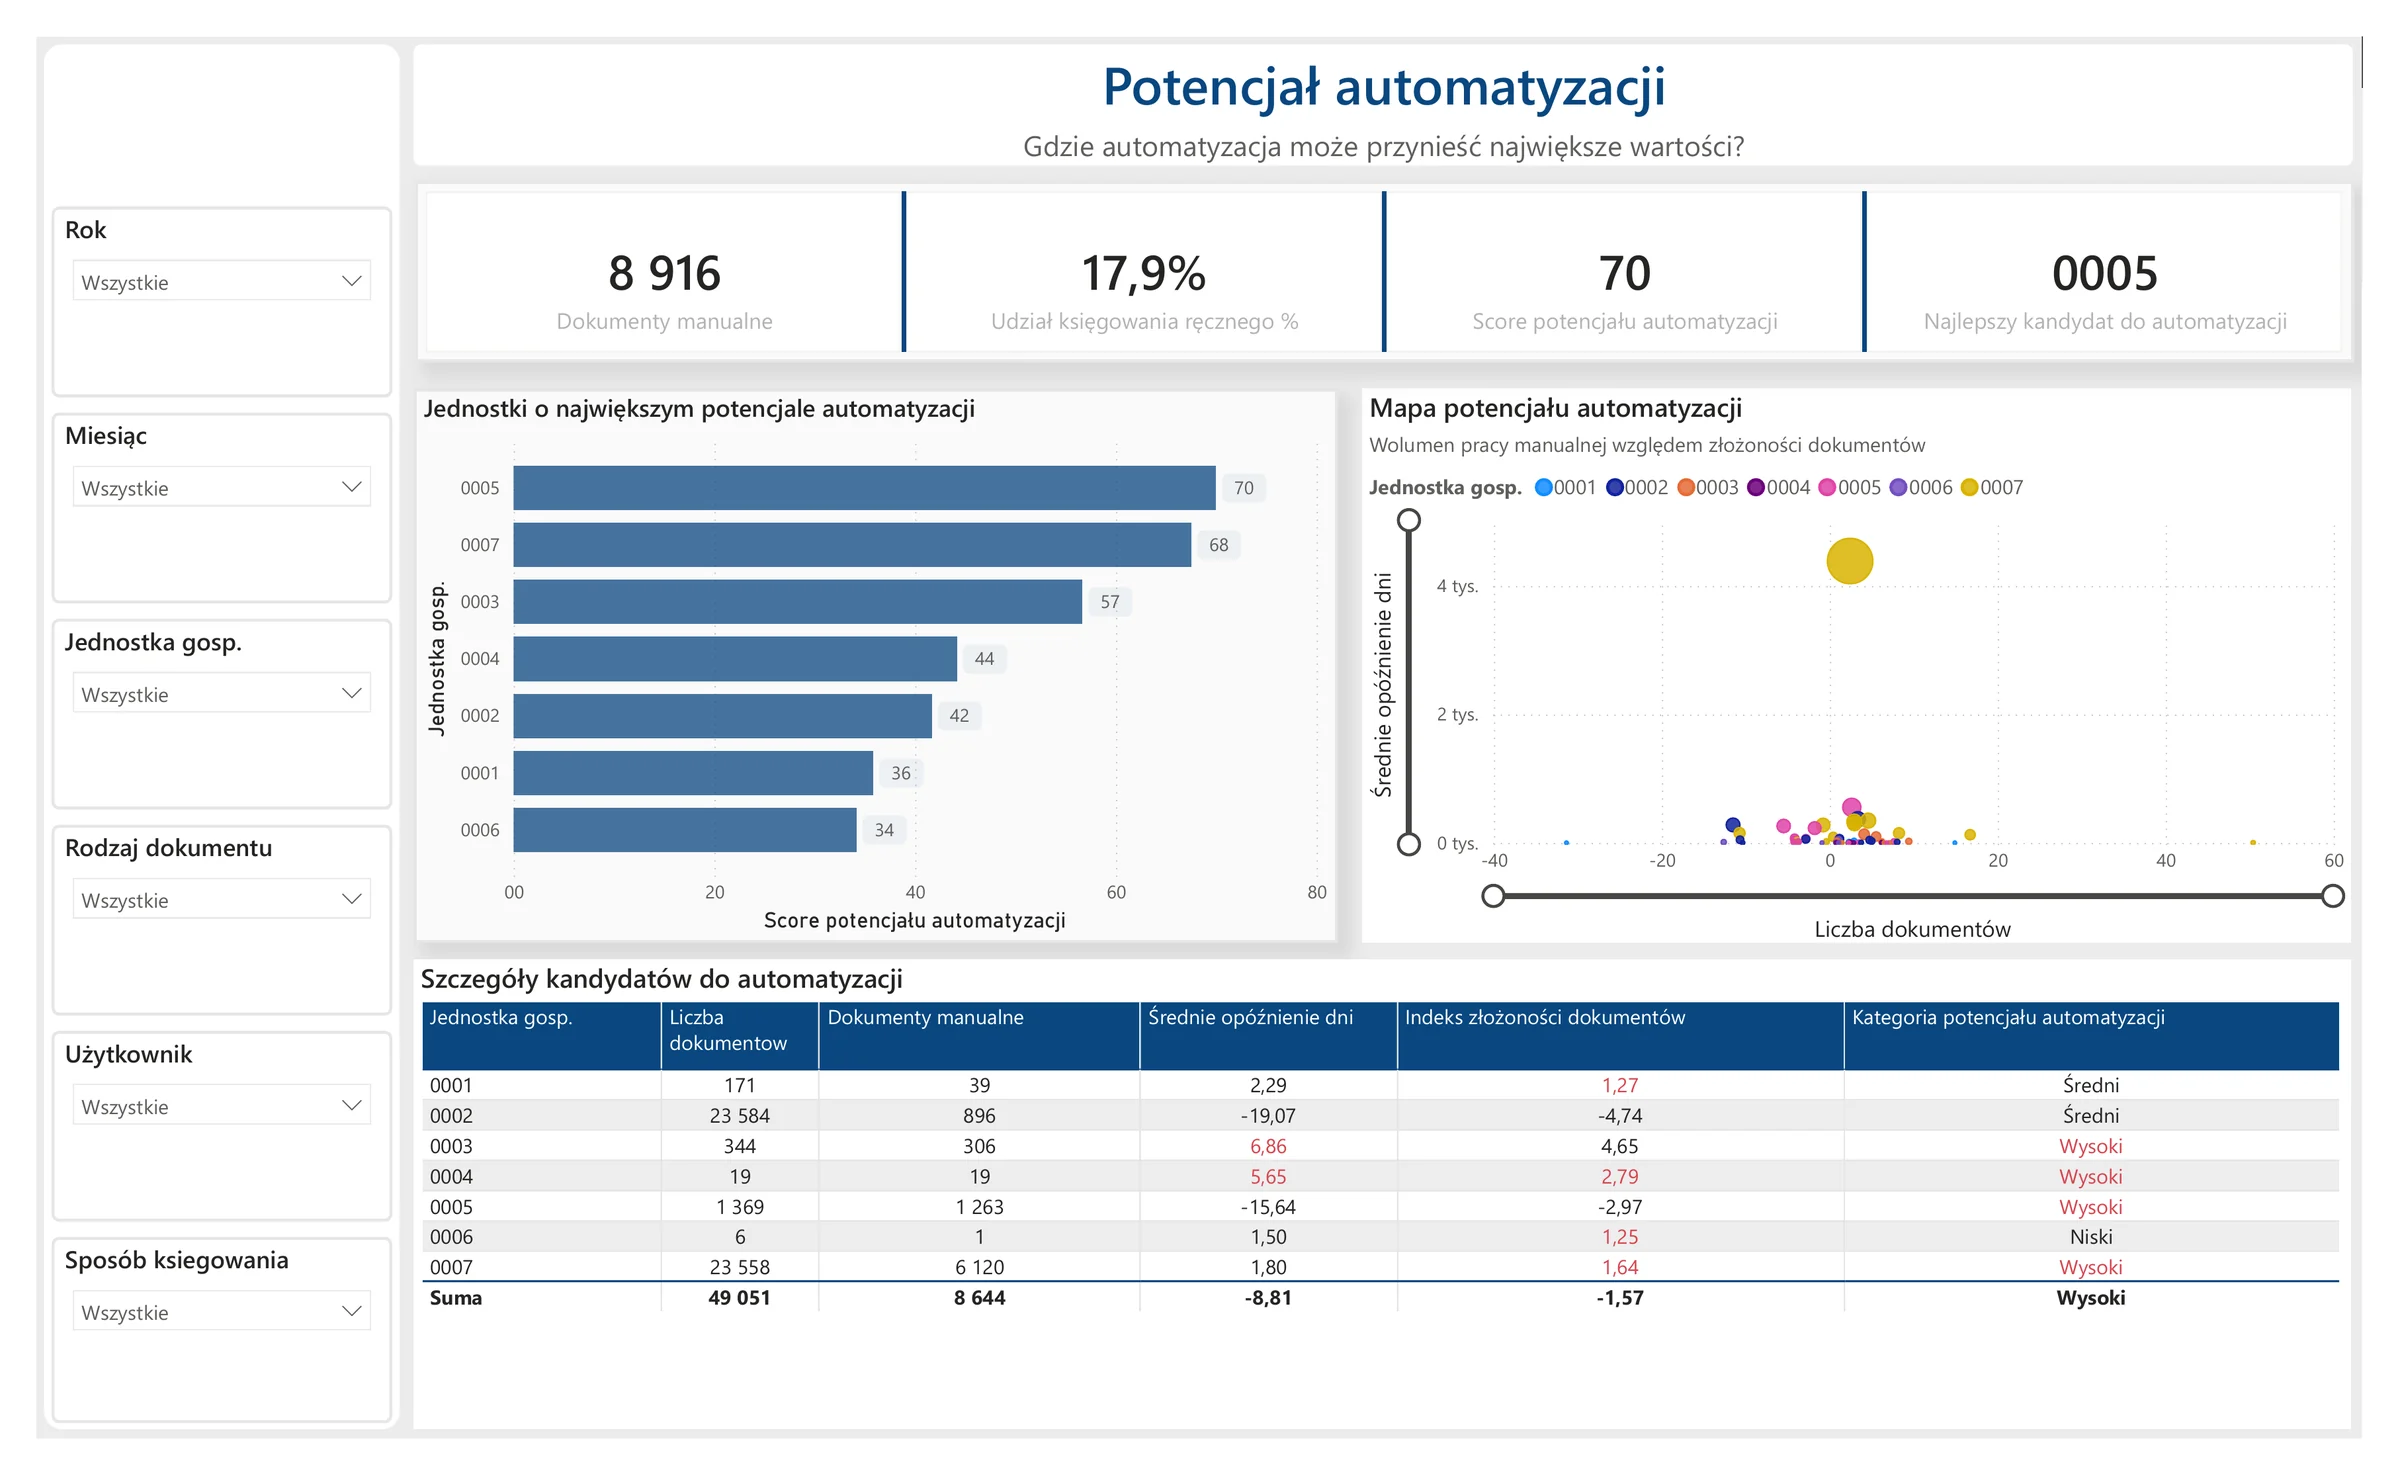
Priority does not come from the share of manual work alone. The report combines volume, delay, complexity, and manual work to identify candidates for further analysis. The process owner decides the order of changes.
We select the scope for the business question and the data available in the system. The demo confirms the following groups of analyses.
Number of cases or documents, share closed, aging, breaches of the agreed completion time (SLA), backlog, and trends.
Average, median, and maximum case or stage duration, active stages, time distribution, and a bottleneck ranking.
Number and share of cases with rework, transitions between stages, the rework trend, and a list of anonymous case identifiers for analysis.
Volume assigned to users, handling time, and backlog. We interpret these together with portfolio size and complexity.
Share of manual and automated handling, number of line items, document type and value, delay, and complexity index.
A ranking of business units or document types based on a combination of scale, manual work, delay, and complexity.
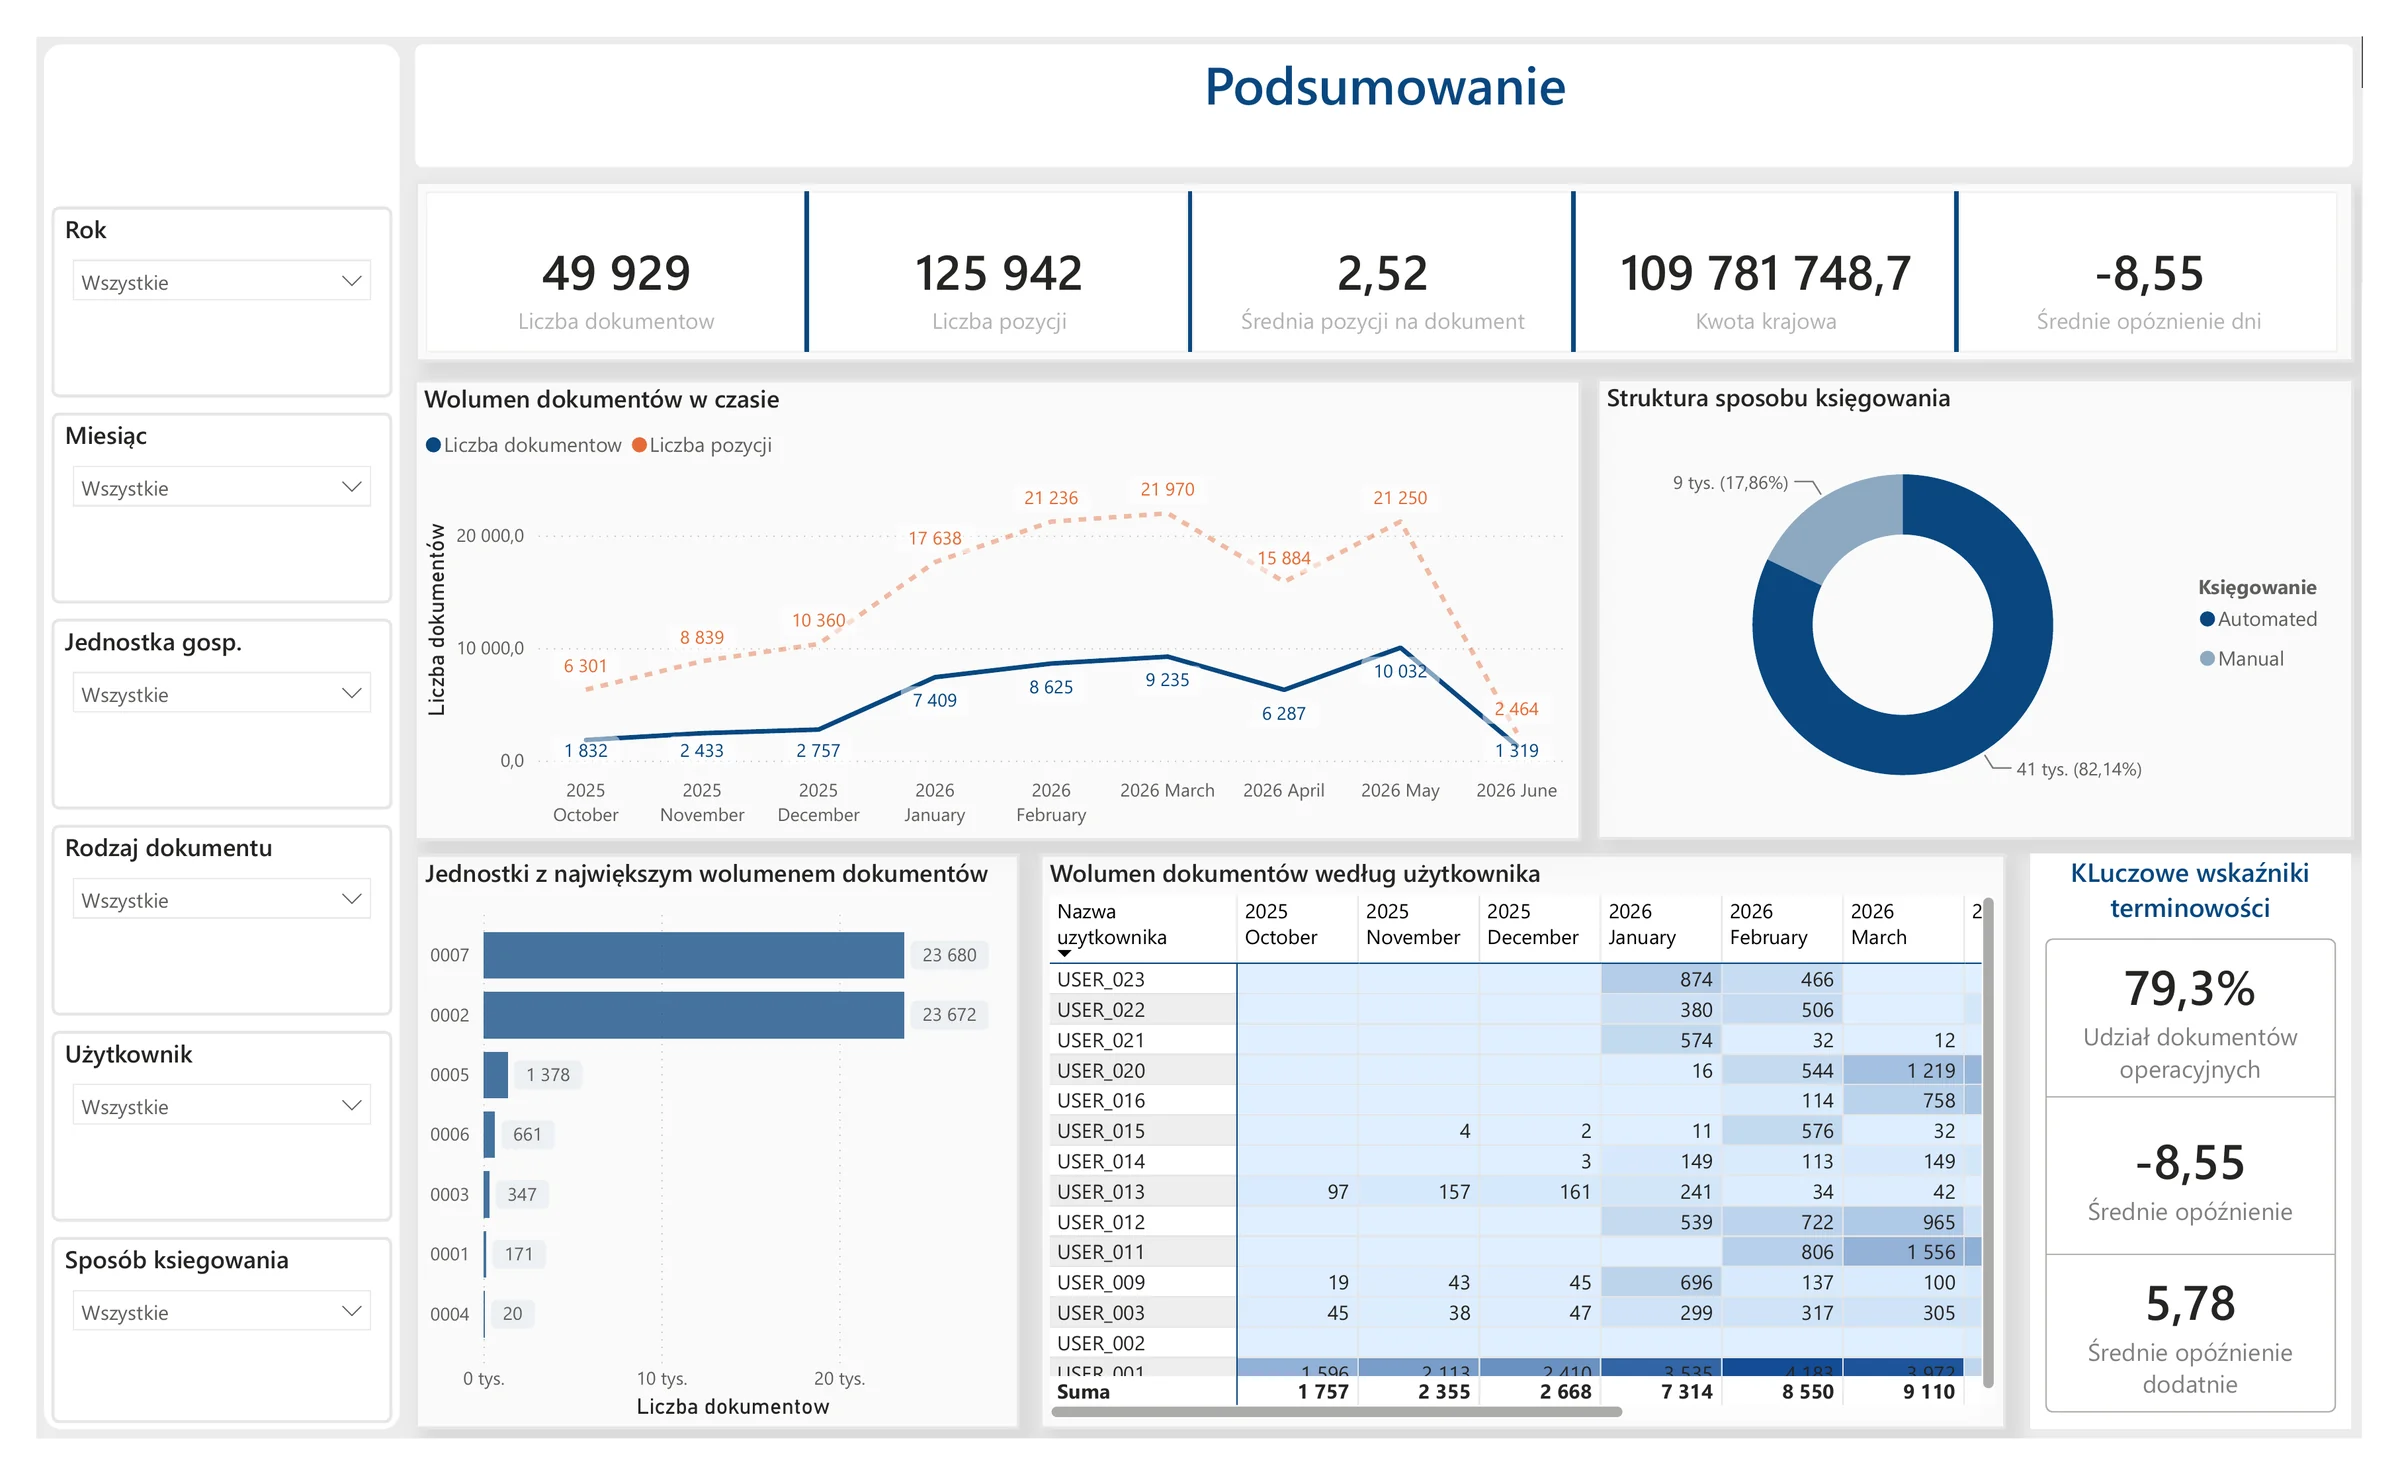
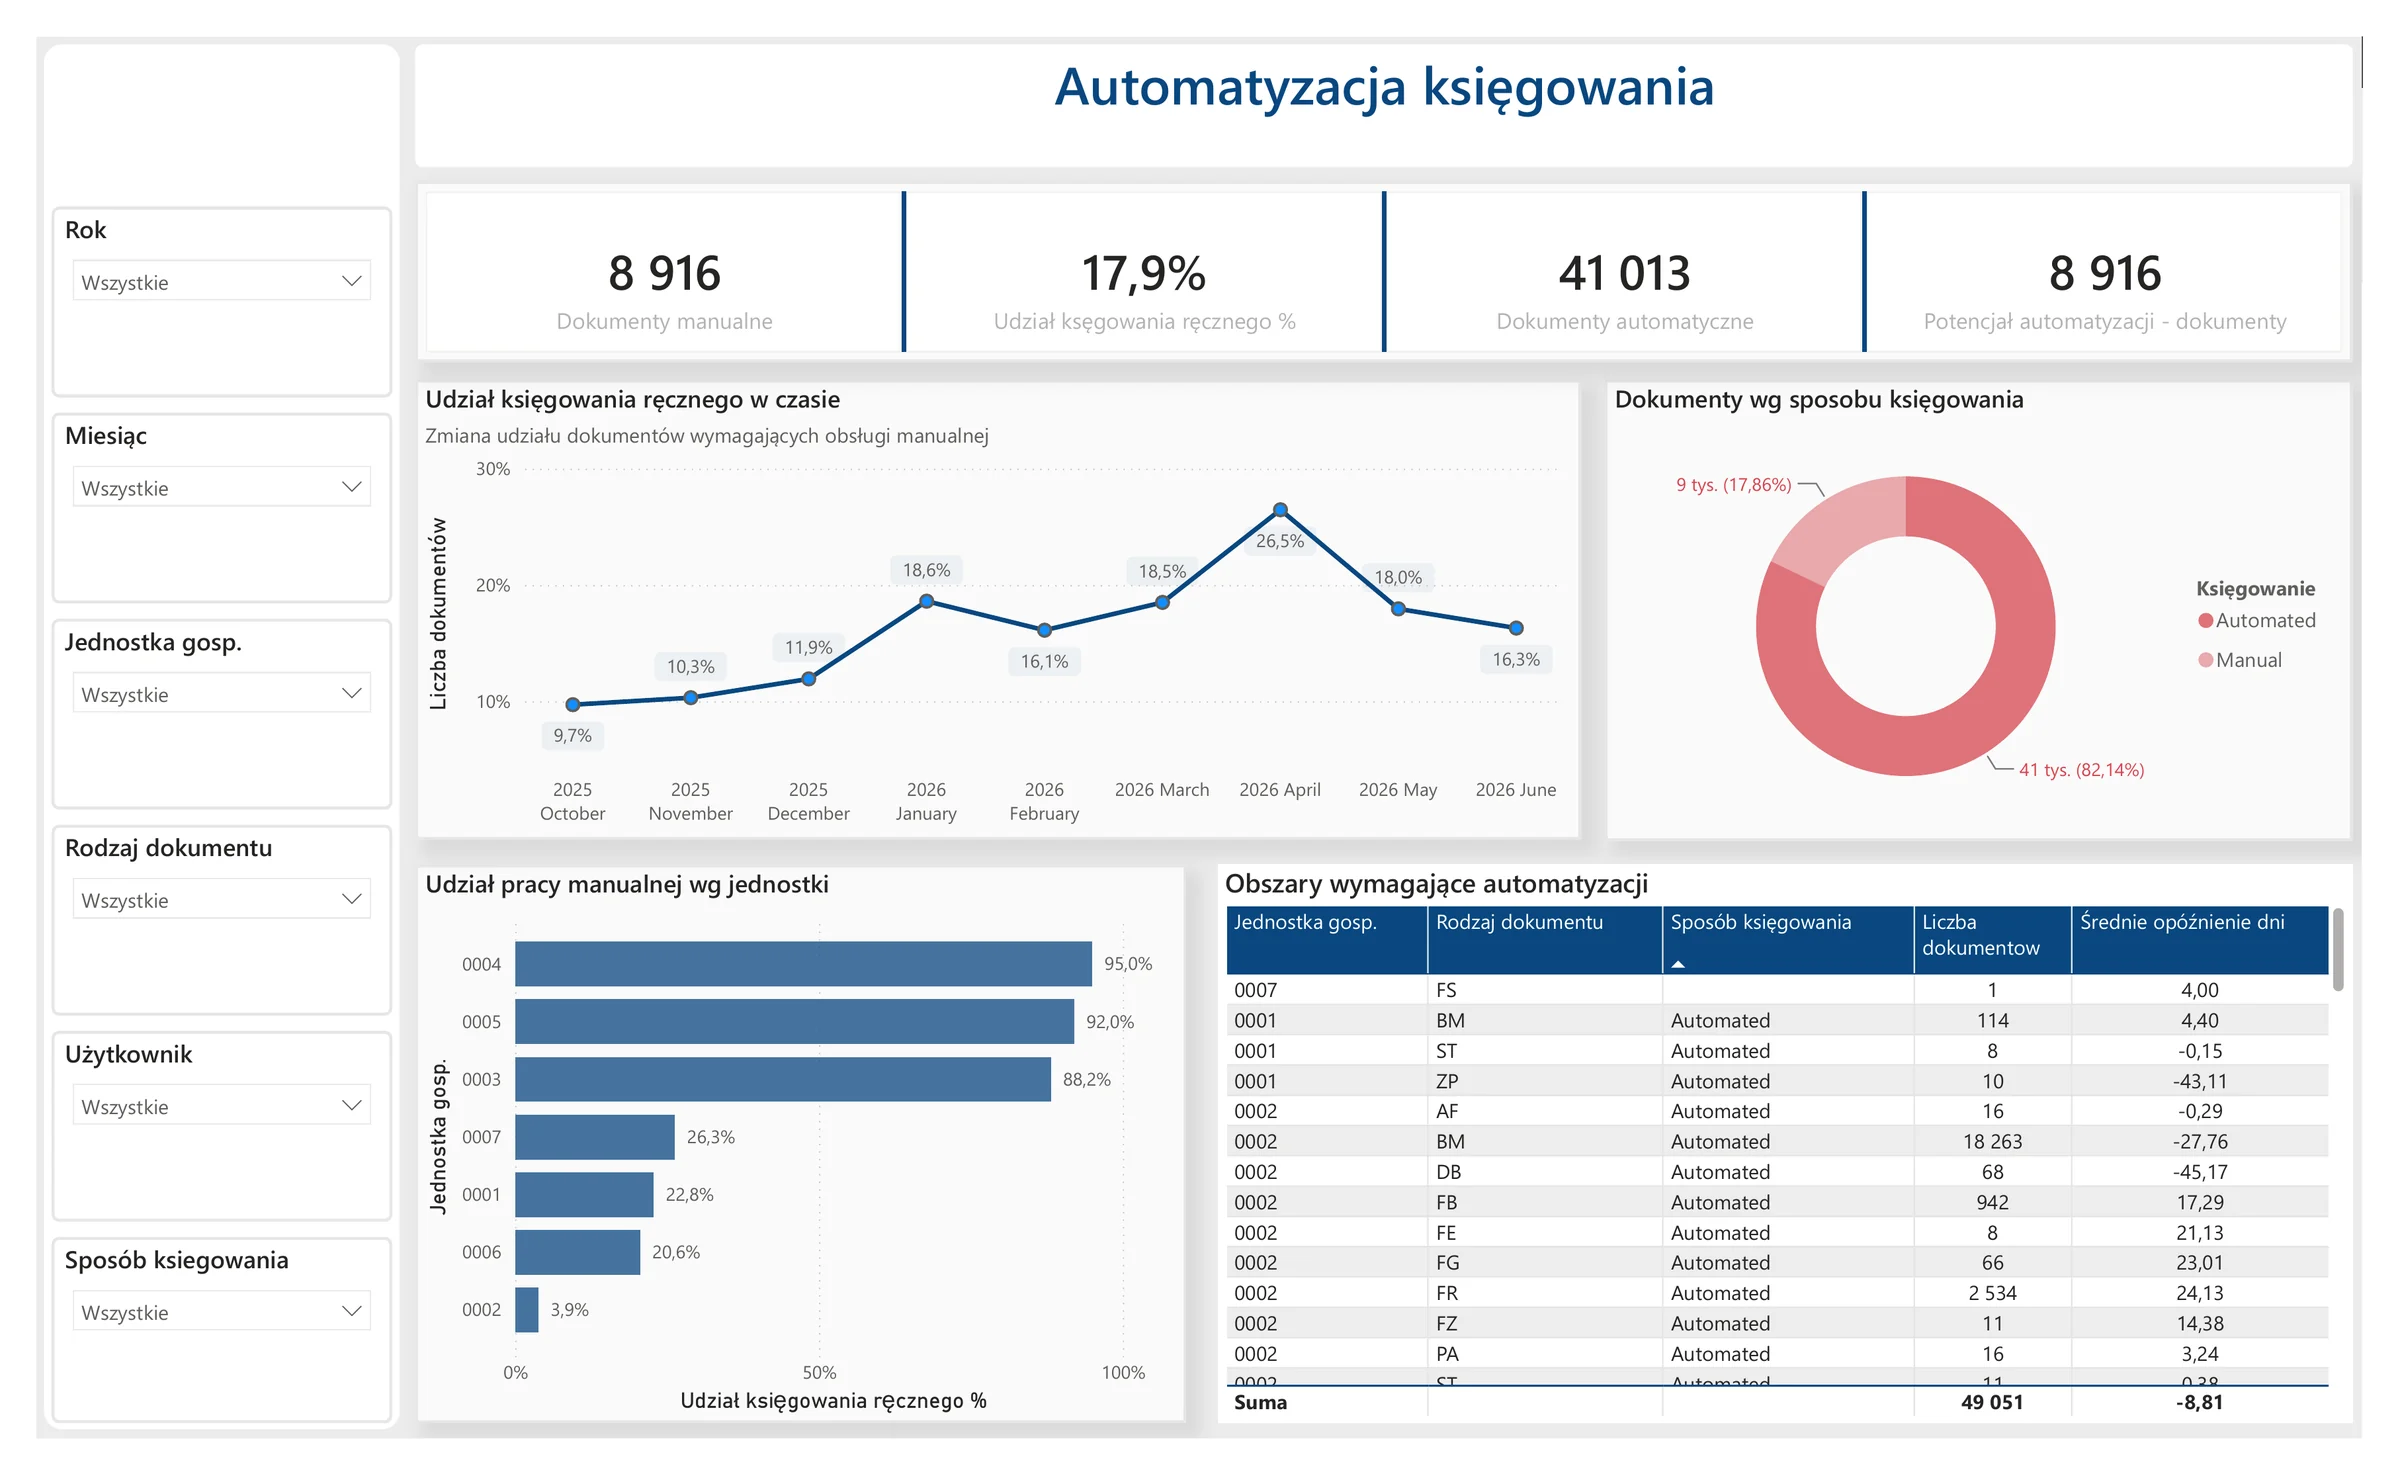
One data model answers operational and management questions without requiring a separate report for every business unit.
A view of stage duration, rework, and bottlenecks identifies the part of the process that should be redesigned.
Backlog, workload, and cases exceeding the agreed threshold determine the team’s work priorities.
The process summary and priority ranking support decisions about organizational changes, automation, and the order of investments.
The sample report was built in Power BI using data from AMODIT. We apply the same analytical approach to data from any BPM or document workflow system. We build the reporting layer in Power BI, Tableau, Qlik, or another tool used by the client.
We combine knowledge of the platform, process configuration, and data with the BI team’s expertise. The report expands the analytics of a production AMODIT implementation.
We start with available data about cases, stages, statuses, time, and accountability. We determine the data extraction method after analyzing the system.
The solution does not depend on Power BI. Tool selection accounts for existing licenses, architecture, security, users, and the maintenance model.
The report scope follows from the process, available data, and the decisions it needs to support. We do not start with a list of charts.
We identify the users, problems, and decisions the report needs to support.
We review the history of cases, stages, and statuses and the available connection method.
We agree on definitions of duration, rework, bottlenecks, and timeliness thresholds.
We build views from summary to diagnosis in the tool selected by the client.
We compare results with the source, test filters, and review the report with users.
After launch, we develop metrics and views as the process changes.
Choose one process and one question the current statuses cannot answer. Based on that, we will review the data, propose the first report scope, and identify what needs to be agreed before pricing.
It is an analysis of data about the flow of cases and documents from a process system. The report combines information about volume, statuses, time, timeliness, rework, stages, and workload to identify areas requiring further analysis or action.
No. AMODIT is the data source in the example shown, but we connect the BI layer to any BPM or document workflow system. We select the data extraction method for the system architecture.
No. The demo was prepared in Power BI, but the report can be built in Tableau, Qlik, or another tool selected by the client. The choice depends on the existing environment, licenses, users, security, and maintenance model.
The same pattern applies to invoices, complaints, tickets, orders, HR processes, document approvals, and other workflows, provided the system records the data required for the agreed metrics.
We select the level of detail for the available data, permissions, and report purpose. The sample report includes lists of anonymous case identifiers and navigation between views. During system analysis, we determine how users will access the source record.
We agree on the completion-time threshold with the process owner. We design bottleneck metrics based on the available data and the business significance of each stage. We do not treat the sample threshold in the demo as a universal SLA.
Its purpose is to analyze the process and workload distribution. A user’s result must be interpreted together with the volume and complexity of the cases handled. The report alone does not automatically determine the effectiveness of a specific person.
Start with one process, one business question, and one person accountable for the outcome. We then review what data the system records and which definitions must be agreed before the first view is built.
We will review the available data and translate it into the first report scope.
Describe your challenge